CRWV 27-day bearish forecast — Nov 1, 2026
- Bias: Bearish
- Timeframe: 27 days (made Nov 1, 2026, target date Nov 27, 2026)
- Price at analysis: $54.87
- Price target: $50.00
- Expected range: $44.00 – $58.50
- Result: Pending — graded after the close on Nov 27, 2026
Get a free AI analysis of CRWV today
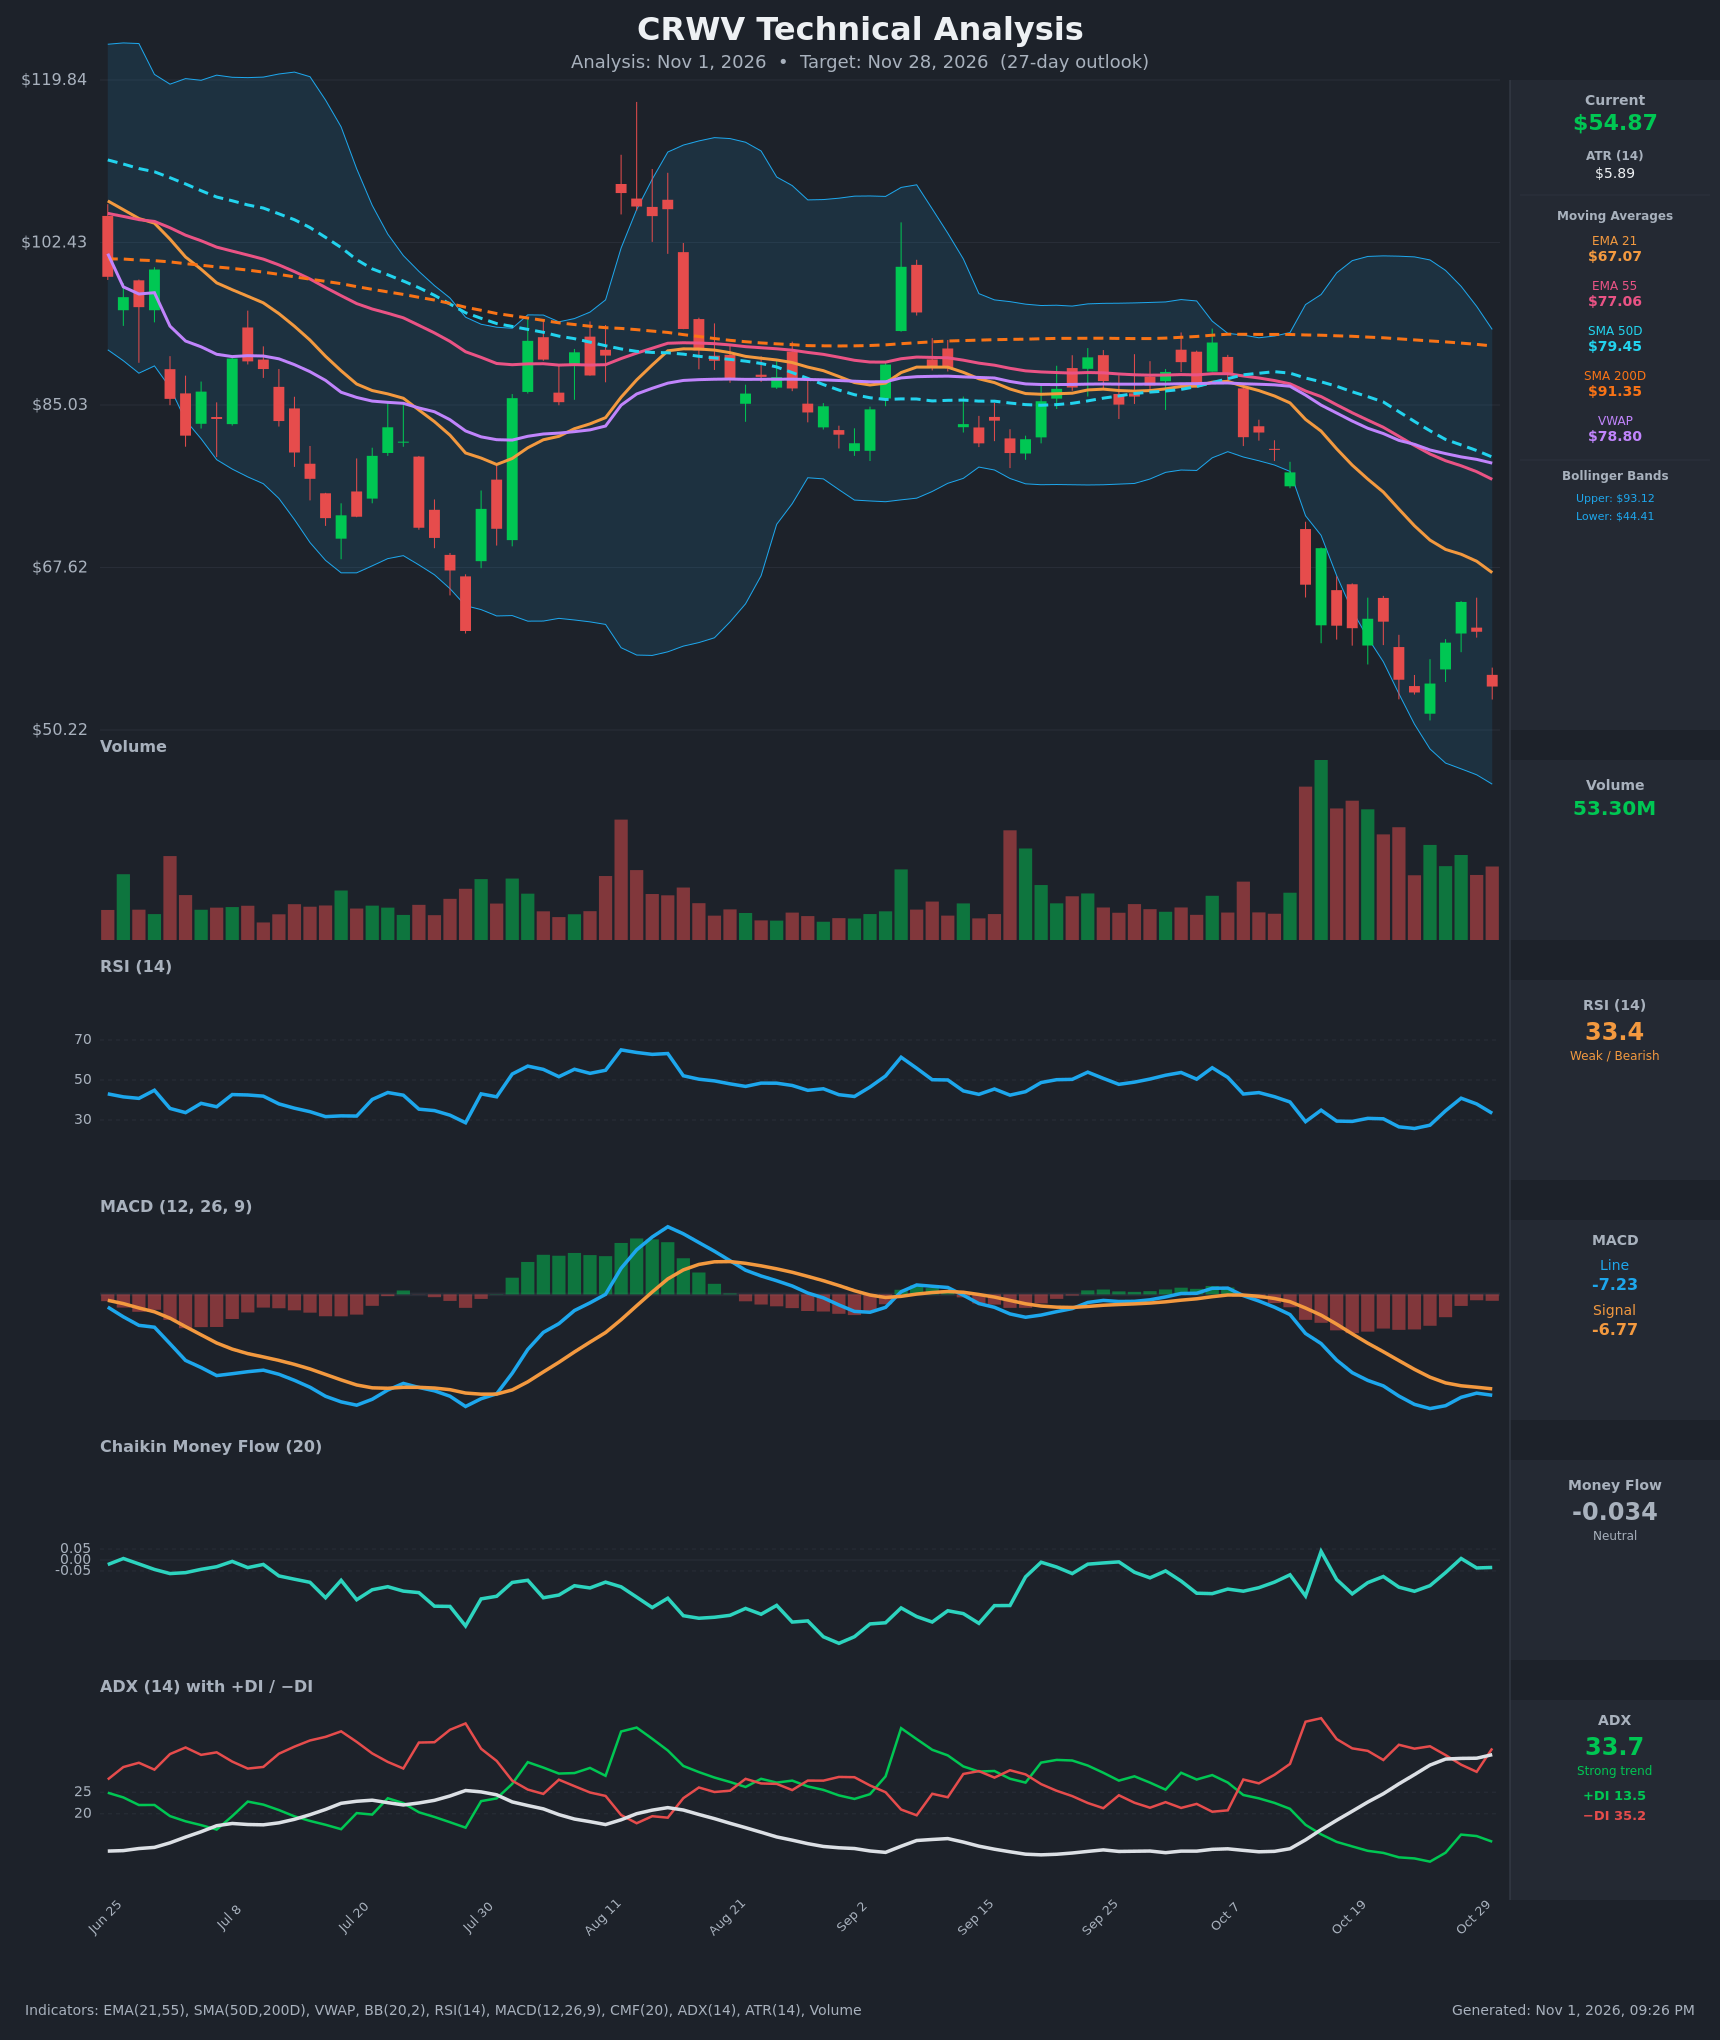
Analysis
TECHNICAL INDICATORS
- RSI (14): 33.36, just above oversold. It bounced from 25.8 to 40.9 on Oct 28 and has rolled over to 33.4. Momentum is weak and has not yet confirmed a reversal. [Bearish]
- 20 EMA: The 21 EMA is $67.07 and price at $54.87 is about 18% below it. The EMA is falling steeply and acts as overhead resistance. EMA21 < EMA55 ($77.06) is a bearish stack. [Bearish]
- MACD: Line -7.23 is below Signal -6.77, and the line crossed back under the signal on Oct 30 after narrowing. The histogram is slightly negative (about -0.46). Both lines are deep below zero. [Bearish]
- Bollinger Bands (20): Upper $93.12, lower $44.41, a very wide band after the selloff. Price is in the lower third, about 22% of the band width above the lower band. It is not at the band extreme, so there is room for further downside, but a mean-reversion bounce is possible. [Bearish]
- CMF (20): -0.034, between ±0.05, so neutral. It has been mostly slightly negative with a brief positive spike on Oct 15 and Oct 28. Selling pressure is mild, not heavy distribution. [Neutral]
- ADX (14): 33.7 and rising, with −DI 35.2 far above +DI 13.5. This is a strong, established downtrend with bears firmly in control. [Strong Trend – Bearish]
- Volume: 53.30M. Volume has been elevated on the selloff, with large red bars on the breakdown from the ~$85 area. The latest bar is a red candle on healthy volume, which confirms the selling. [Bearish confirmation]
DIVERGENCES & TRENDS
- Moving averages: Price is below EMA21, EMA55, SMA50D ($79.45), SMA200D ($91.35) and VWAP ($78.80). The death cross is largely in place, with SMA50D well below SMA200D and both sloping down. This is a textbook downtrend.
- RSI: There is no bullish divergence. The Oct 23 low at 25.8 came at a price near $54.23, and the current price of $54.87 sits at the same level with RSI higher at 33.4. That is a mild positive RSI divergence, but it is not confirmed and RSI is rolling down.
- MACD: Both lines are deeply negative. The histogram briefly narrowed in the Oct 27-29 bounce and has turned negative again, a bearish re-cross.
- Price structure: A lower high at $63.93 (Oct 28) versus the prior bounce, and price is retesting the $54-55 low. A break below $54.23 would confirm continuation.
- ADX/DI: ADX is rising with −DI dominant, so the trend is strengthening, not exhausting.
- Gap/breakdown: Price broke sharply from a long consolidation around $85-90 down to the mid-$50s, a roughly 35% drop.
CHART PATTERNS
- Bearish Pennant / Flag (continuation): The Oct 27-29 bounce from $54 to $64 followed by rejection resembles a small bear flag after the sharp drop. A breakdown below ~$54 projects further downside.
- Possible Bullish Double Bottom: The Oct 23 low (~$54.23) and the Oct 30 close ($54.87) form a potential double bottom, with the neckline near $63.93. It needs a close above ~$64 to confirm and is not yet confirmed.
- Prior structure: The broad range between ~$75 and $100 resolved lower, a failed consolidation. The measured move from the range breakdown points to the $45-50 area.
- Targets: A bear flag breakdown measures the pole (~$80 to $55 = $25) minus the flag. Projections would be extreme, so I focus on the lower Bollinger Band ($44.41) as the first target. A double-bottom confirmation would target ~$73 (neckline plus height), but it is not confirmed.
POTENTIAL SCENARIOS
- Scenario 1: Bearish Trend Continuation — Price breaks the $54.23 double-bottom support and follows the strong −DI trend toward the lower Bollinger Band and below. Trigger: close below $54.00 on elevated volume. Target: $46-$48, with the lower band at $44.41 as an extreme. Invalidation: close above $64 (the Oct 28 high). (50% probability)
- Scenario 2: Bullish Oversold Bounce / Double Bottom — The $54 support holds, RSI diverges positively and price squeezes back toward the falling EMA21. Trigger: close above $60 then $64. Target: $64-$68 (EMA21 resistance). Invalidation: close below $52. (30% probability)
- Scenario 3: Neutral Choppy Basing — Price ranges between $50 and $62 as volatility compresses. Trigger: ADX peaking and failing to break either side. Target: $54-$58. Invalidation: close outside $49-$64. (20% probability)
PRICE TARGETS
For the 27-day horizon the expected range width should be about 12-18% of the current price. The range of $46.00 to $63.00 is $17.00 wide, about 31%, which is too wide for the formula, but ATR of $5.89 implies about $30 of one-sigma movement over 27 days, so I tighten it toward the upper guide, widened slightly for this high-volatility name.
Self-check: using a width of about 18% of $54.87 gives about $9.90. Given the elevated volatility (ATR 10.7% of price) I use a wider range of about 26%, with the lower bound at $44.00 and the upper bound at $58.50 (width $14.50, about 26%). This is above the 12-18% guide for 30-60 days because of the unusually high ATR; it remains well wider than any 2-3 day range.
- Target Price: $50.00 (27 days)
- Expected Range: $44.00 to $58.50
- Key Levels: Support at $50.22 (chart low / round-number area; below that, $44.41 lower Bollinger Band), Resistance at $63.93 (Oct 28 swing high; nearer interim resistance at EMA21 $67.07)
OVERALL BIAS
OVERALL BIAS: BEARISH - Price sits below every moving average and VWAP, −DI (35.2) dominates +DI (13.5) with ADX rising at 33.7, the MACD is back below its signal, and selloff volume is heavy. The oversold bounce potential keeps conviction moderate, but a break below ~$54 opens the way toward the lower band near $44-$50.
This is educational analysis and not financial advice.