GOOGL 27-day bearish forecast — Nov 1, 2026
- Bias: Bearish
- Timeframe: 27 days (made Nov 1, 2026, target date Nov 27, 2026)
- Price at analysis: $279.84
- Price target: $272.00
- Expected range: $250.00 – $298.00
- Result: Pending — graded after the close on Nov 27, 2026
Get a free AI analysis of GOOGL today
Analysis
TECHNICAL INDICATORS
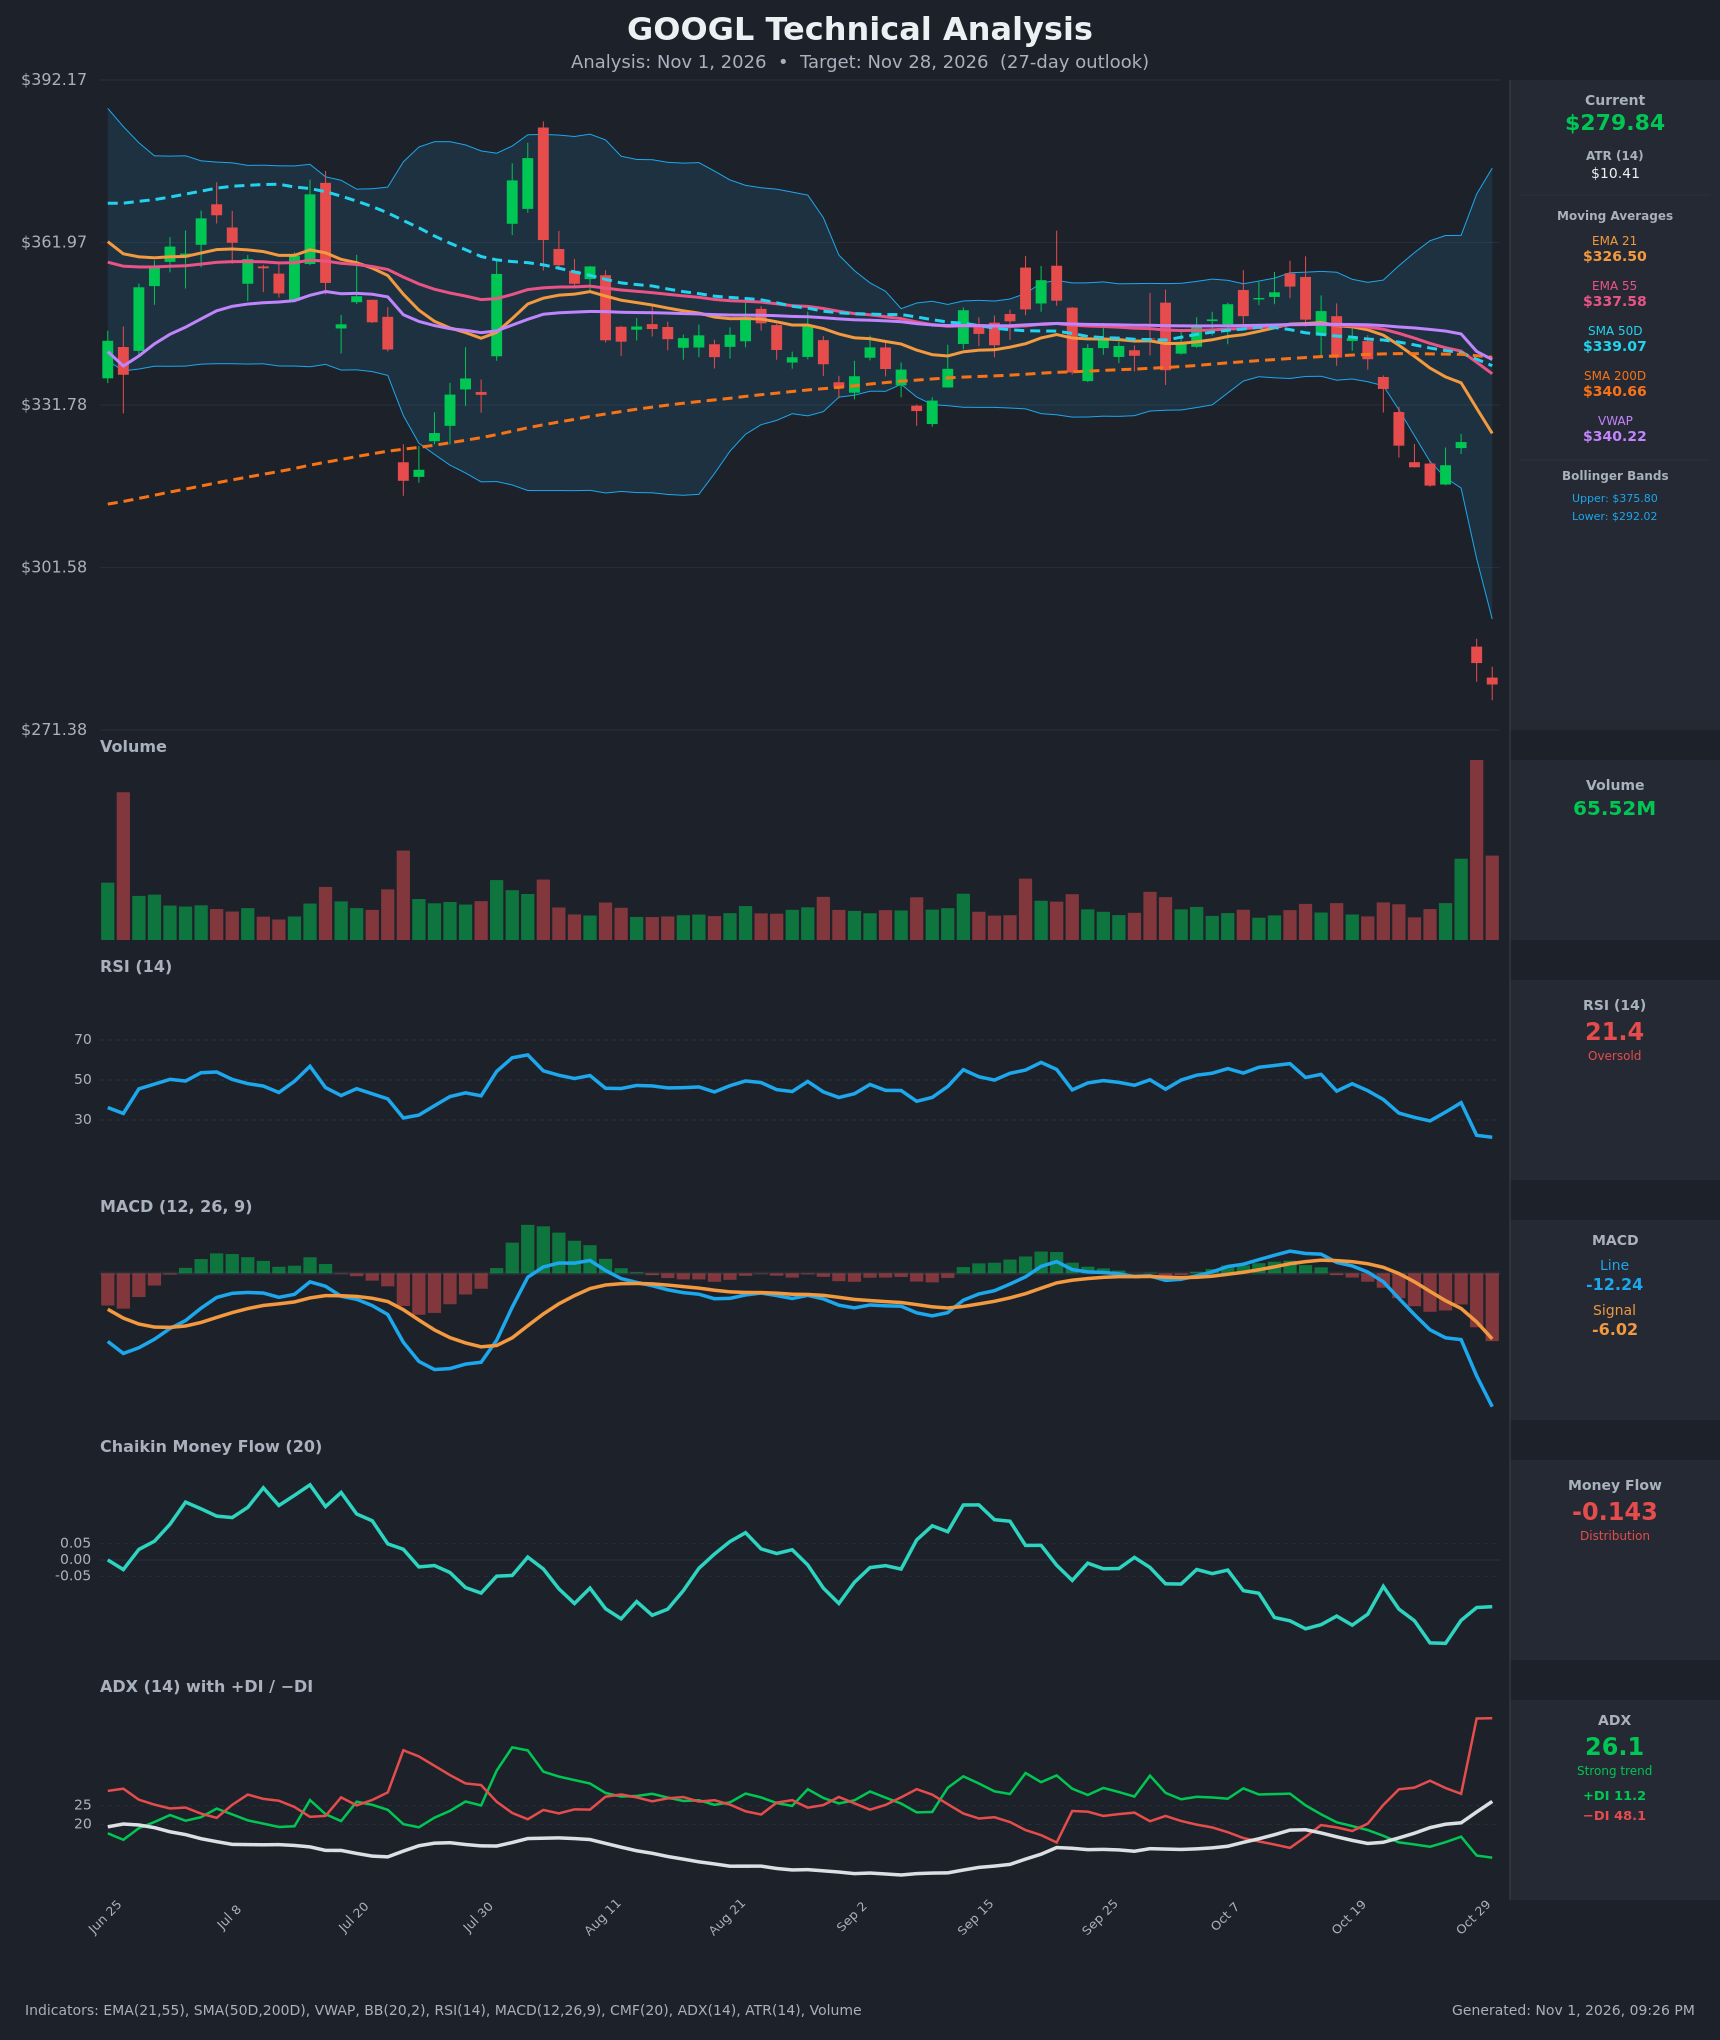
- RSI (14): 21.38, deeply oversold and down from 38.7 on Oct 28 and 57 in mid-October. Momentum is still falling, though readings this low often come before at least a relief bounce. [Bearish]
- 20 EMA: The supplied value is EMA 21 at $326.50, and price at $279.84 is about 14% below it. EMA 21 is below EMA 55 ($337.58) and sloping down, so it acts as overhead resistance. [Bearish]
- MACD: The line (-12.24) is below the signal (-6.02) and the gap is widening. The bearish cross happened around Oct 22, and the histogram is increasingly negative. [Bearish]
- Bollinger Bands (20): The bands are $292.02 to $375.80. Price is about $12 (4%) below the lower band after a volatility expansion, and the bands are fanning out. This is stretched and could snap back, but a close outside the band in an expanding-volatility move often marks trend continuation. [Bearish]
- CMF (20): -0.143, well below -0.05 and negative throughout the October decline. Selling pressure is persistent, and the Oct 29 volume spike came with distribution. [Distribution]
- ADX (14): 26.1 and rising sharply from about 15. −DI at 48.1 is far above +DI at 11.2, so the new trend is strong and bearish. [Strong Trend – Bearish]
- Volume: 65.52M, the largest bar on the chart, on a gap-down of about 12.6% (from $324.89 to $283.82). This is either a capitulation/news event or the start of institutional repricing. Follow-through selling on Oct 30 (a further -$4) points to continued supply. [Bearish with possible climactic exhaustion]
DIVERGENCES & TRENDS
- Divergences: There is no bullish RSI or MACD divergence. Both made new lows with price, so momentum confirms the move.
- Moving averages: Price is below EMA21, EMA55, SMA50D ($339.07), SMA200D ($340.66) and VWAP ($340.22). EMA21 crossed below EMA55 around Oct 22-23, a bearish crossover. The 50D and 200D are nearly converged ($339.07 vs $340.66), so a death cross is imminent.
- Price vs 200D: Price is about 18% below the SMA200D, a decisive break of the long-term trend.
- ADX/DI: −DI crossed above +DI around Oct 20-21 and has since exploded higher.
- Volatility: The ATR of $10.41 is elevated, so daily swings of 3-4% are plausible.
CHART PATTERNS
- Rectangle/range breakdown (Bearish Triple Top-style range): From August to mid-October, price was range-bound between about $335 and $360 around flat moving averages. The break below $320-$325 with a gap is a bearish range breakdown. The range height (about $30-$35) projects to roughly $285-$290, which has already been reached.
- No reversal base yet: No Double Bottom or Inverted Head and Shoulders is visible. Two candles with small bodies after the gap do not make a base.
- Gap overhead: The gap zone ($284-$325) is supply, and any bounce will likely stall at or below the lower Bollinger Band near $292 and certainly below $310.
POTENTIAL SCENARIOS
- Scenario 1: Bearish Trend Continuation / Post-Gap Drift — Selling pressure persists with −DI dominant and a death cross forming. Price consolidates with weak bounces, then makes lower lows. Trigger: Close below $270 or failure at $292. Target: $265 to $255. Invalidation: Daily close above $300. (45% probability)
- Scenario 2: Bullish Oversold Relief Bounce — RSI near 21 and price far outside the lower band trigger a mean-reversion rally to fill part of the gap. Trigger: Reclaim of $292 (lower BB) on rising volume. Target: $300 to $310 (the gap and EMA21 at about $326 would be the extended test). Invalidation: Rejection at $292-$300 and a new low under $270. (40% probability)
- Scenario 3: Neutral Base Building — Price stabilizes after the climactic volume and chops in a wide $270-$295 range while indicators reset. Trigger: Several sessions of narrowing ranges with RSI back above 30. Target: $275 to $290. Invalidation: Close outside $265-$300. (15% probability)
PRICE TARGETS
- Target Price: $272.00 (27-day horizon; modest downside as continued trend pressure slightly outweighs the oversold-bounce risk)
- Expected Range: $250.00 to $298.00 (width $48, about 17.2% of current price, consistent with the 30-60 day guidance of 12-18%)
- Key Levels: Support at $268.00, Resistance at $292.02
OVERALL BIAS
OVERALL BIAS: BEARISH - Price is below every moving average and VWAP, MACD and CMF are deeply negative, and ADX is rising with −DI at 48 versus +DI at 11 after a record-volume gap down. Oversold RSI (21) and a close outside the lower Bollinger Band make a sharp relief rally a real risk, so conviction is modest.
This is educational analysis and not financial advice.