HOOD 27-day bearish forecast — Nov 1, 2026
- Bias: Bearish
- Timeframe: 27 days (made Nov 1, 2026, target date Nov 27, 2026)
- Price at analysis: $84.99
- Price target: $82.50
- Expected range: $72.00 – $91.50
- Result: Pending — graded after the close on Nov 27, 2026
Get a free AI analysis of HOOD today
Analysis
TECHNICAL INDICATORS
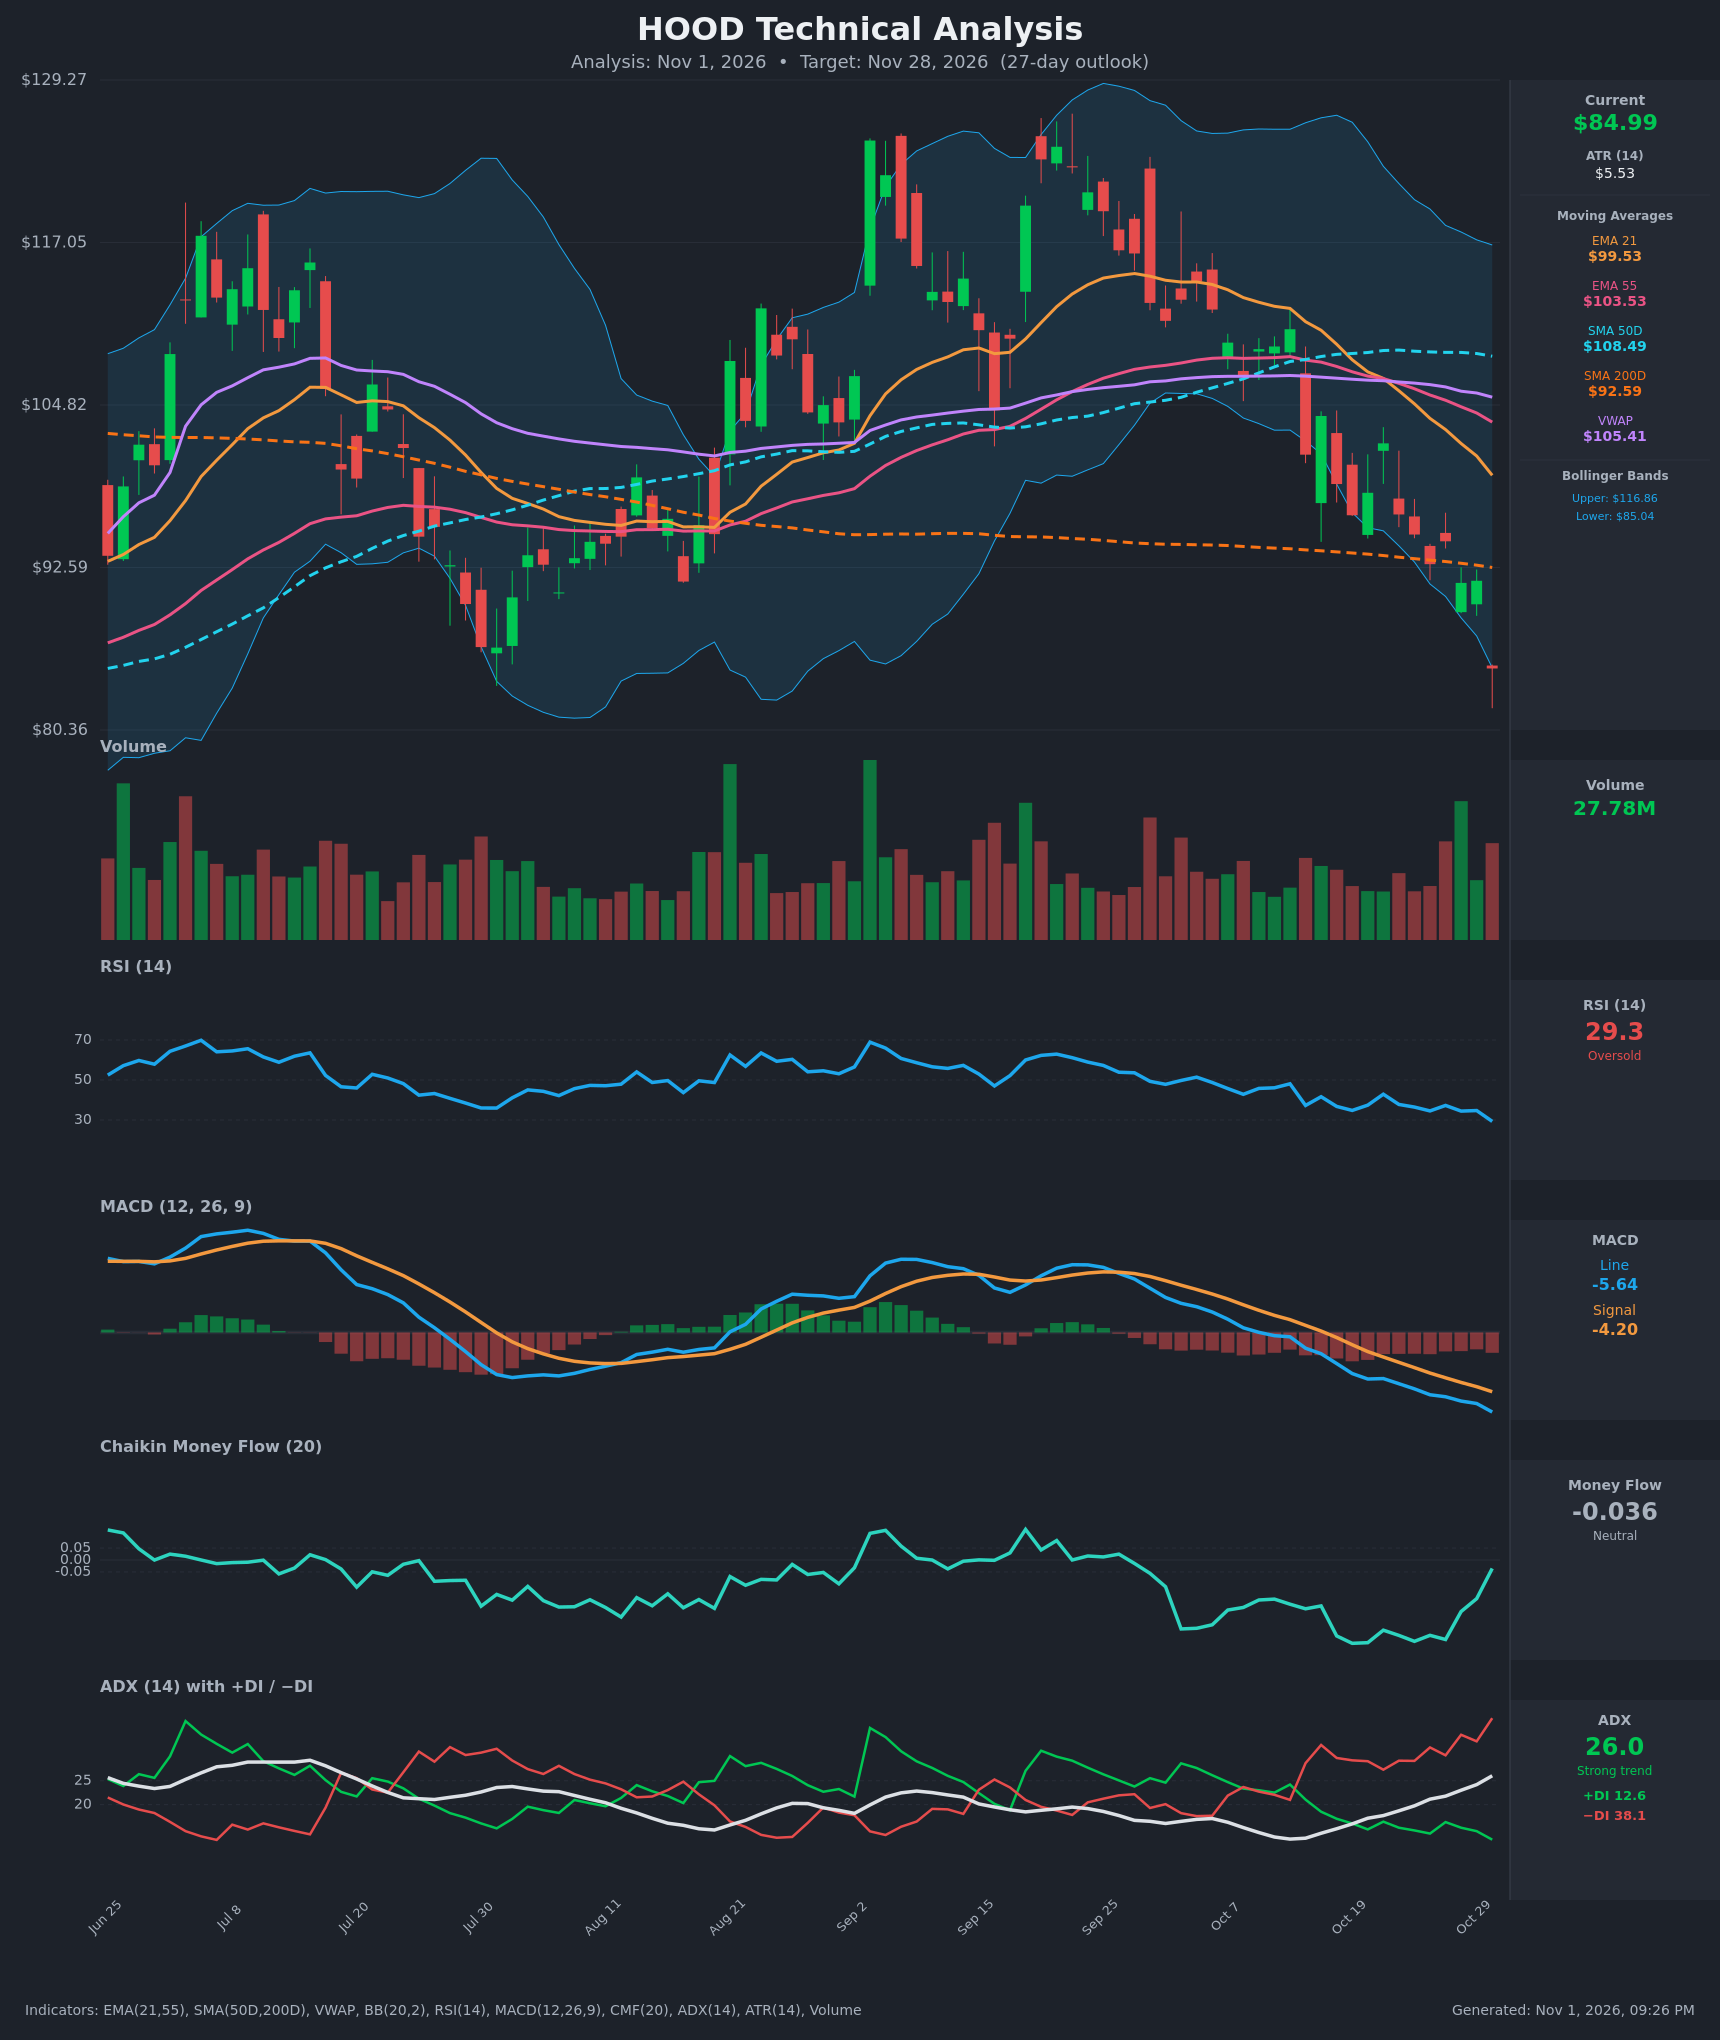
- RSI (14): 29.3, just under the 30 oversold line and falling from 46 on Oct 12. It has made lower lows with no sign of a turn yet. Oversold readings in a strong downtrend can persist, so this signals exhaustion risk more than a reversal. [Bearish]
- 20 EMA (EMA 21): $99.53, with price at $84.99 about 14.6% below it. The EMA is falling steeply and has crossed below EMA 55 ($103.53), which is a bearish crossover. It now acts as overhead resistance. [Bearish]
- MACD: Line -5.64 is below signal -4.20 and the gap is widening. The histogram is negative and expanding. The bearish crossover happened around Oct 16, and momentum has accelerated since. [Bearish]
- Bollinger Bands (20): Upper $116.86, lower $85.04. Price at $84.99 sits right at or just below the lower band. The bands are widening and the candle has a long lower wick, which points to an extended move. In a trend this usually means a "band walk", though a snap-back toward the mid-band is possible. [Bearish]
- CMF (20): -0.036, in the neutral zone. It has risen from -0.35 to -0.04, which points to selling pressure fading, while price is still making new lows. That is a mild bullish divergence. [Neutral]
- ADX (14): 26.0 and rising, with +DI at 12.6 and -DI at 38.1. This is a strong, established downtrend with bears firmly in control (-DI is on top by more than 25 points). [Strong Trend – Bearish]
- Volume: 27.78M on the latest bar, a down candle that broke to new lows. Volume is moderately elevated against the recent average, which confirms the breakdown with some conviction. [Bearish confirmation, possible capitulation]
DIVERGENCES & TRENDS
- CMF vs price: CMF has recovered from about -0.35 to -0.04 while price fell from $96 to $85. This is a bullish divergence and suggests selling pressure is easing, but it has not yet turned into accumulation.
- RSI: No bullish divergence. RSI is making lower lows with price (29.3 vs 34.5 on Oct 26-28), so momentum is still confirming the decline.
- MACD: Line and signal are both well below zero and still diverging. There is no sign of a bullish cross.
- Moving averages: EMA 21 is below EMA 55, and both are below SMA 50D ($108.49), a bearish stack. The 50D is now only about 17% above price. The 50D is still above the 200D, so there is no death cross yet, but the gap is narrowing.
- Long-term trend: Price is now below SMA 200D ($92.59) for the first time in this window, a break of the long-term trend line. The 200D is now overhead resistance.
- VWAP: $105.41, well above price, so sellers are in control.
- DI: -DI crossed above +DI on Oct 14 and the spread keeps widening.
CHART PATTERNS
- Bearish Head and Shoulders / Double Top (reversal): The Sep 2 high (~$125) and the Sep 18-25 high (~$126) roughly form a double top or right-shoulder structure. The neckline near $104-105 was lost on Oct 14 and price has since slid to $85. The measured move is the pattern height (~$22) projected from the neckline, which gives about $82-83. That is nearly reached.
- Bearish continuation: The Oct 21 bounce to $101.93 failed under EMA 21 and made a lower high. This is a stair-step lower-high, lower-low sequence.
- Possible support: The Jul 30 - Aug 11 base was around $85-90, and the long lower wick on the last candle suggests some buyers near $82-83. A Bullish Double Bottom or Falling Wedge is not yet confirmed.
POTENTIAL SCENARIOS
- Scenario 1: Bearish Trend Continuation — The trend remains strong (ADX rising, -DI dominant) and price walks the lower band. The measured move from the double top and a weak bounce profile favour more downside, with relief rallies failing at $92-95. Trigger: a daily close below the $82-83 wick low. Target: $76-78 (about 1.5 ATR-based extension below the current low). Invalidation: a daily close above $96 (SMA 200D and EMA 21 zone). (45% probability)
- Scenario 2: Bullish Oversold Bounce, then Range — RSI below 30, a price at the lower band and CMF recovering make a relief rally likely. Price rebounds toward the SMA 200D at ~$92.6 and stalls under EMA 21 resistance. Trigger: RSI back above 35 with a close above $89. Target: $91-94. Invalidation: a close below $82. (38% probability)
- Scenario 3: Neutral Basing — Price holds $80-90 as selling dries up and CMF turns positive. Trigger: tight candles on declining volume. Target: $85-88 in the range. Invalidation: a break of either $80 or $92. (17% probability)
PRICE TARGETS
For the 27-day horizon, the strong trend (ADX 26 with a wide -DI lead) and the bearish moving-average structure argue for a lower target. A partial relief bounce is likely along the way because the stock is stretched against the lower band and RSI is oversold. I expect the stock to end modestly below the current price.
- Target Price: $82.50 (27-day, about 2.9% below current)
- Expected Range: $72.00 to $91.50 (width $19.50, about 22.9% of current price, which fits the 18-30% guidance for this horizon)
- Key Levels: Support at $80.36, Resistance at $92.59
OVERALL BIAS
OVERALL BIAS: BEARISH - ADX at 26 with -DI at 38.1 versus +DI at 12.6, a MACD bearish cross with a widening histogram, price below every key moving average including SMA 200D, and a lost double-top neckline all favour continued downside. Oversold RSI and recovering CMF suggest bounces along the way, which is why the target is only modestly lower.
This is educational analysis and not financial advice.