DELL 27-day bearish forecast — Nov 1, 2026
- Bias: Bearish
- Timeframe: 27 days (made Nov 1, 2026, target date Nov 27, 2026)
- Price at analysis: $424.30
- Price target: $405.00
- Expected range: $372.00 – $440.00
- Result: Pending — graded after the close on Nov 27, 2026
Get a free AI analysis of DELL today
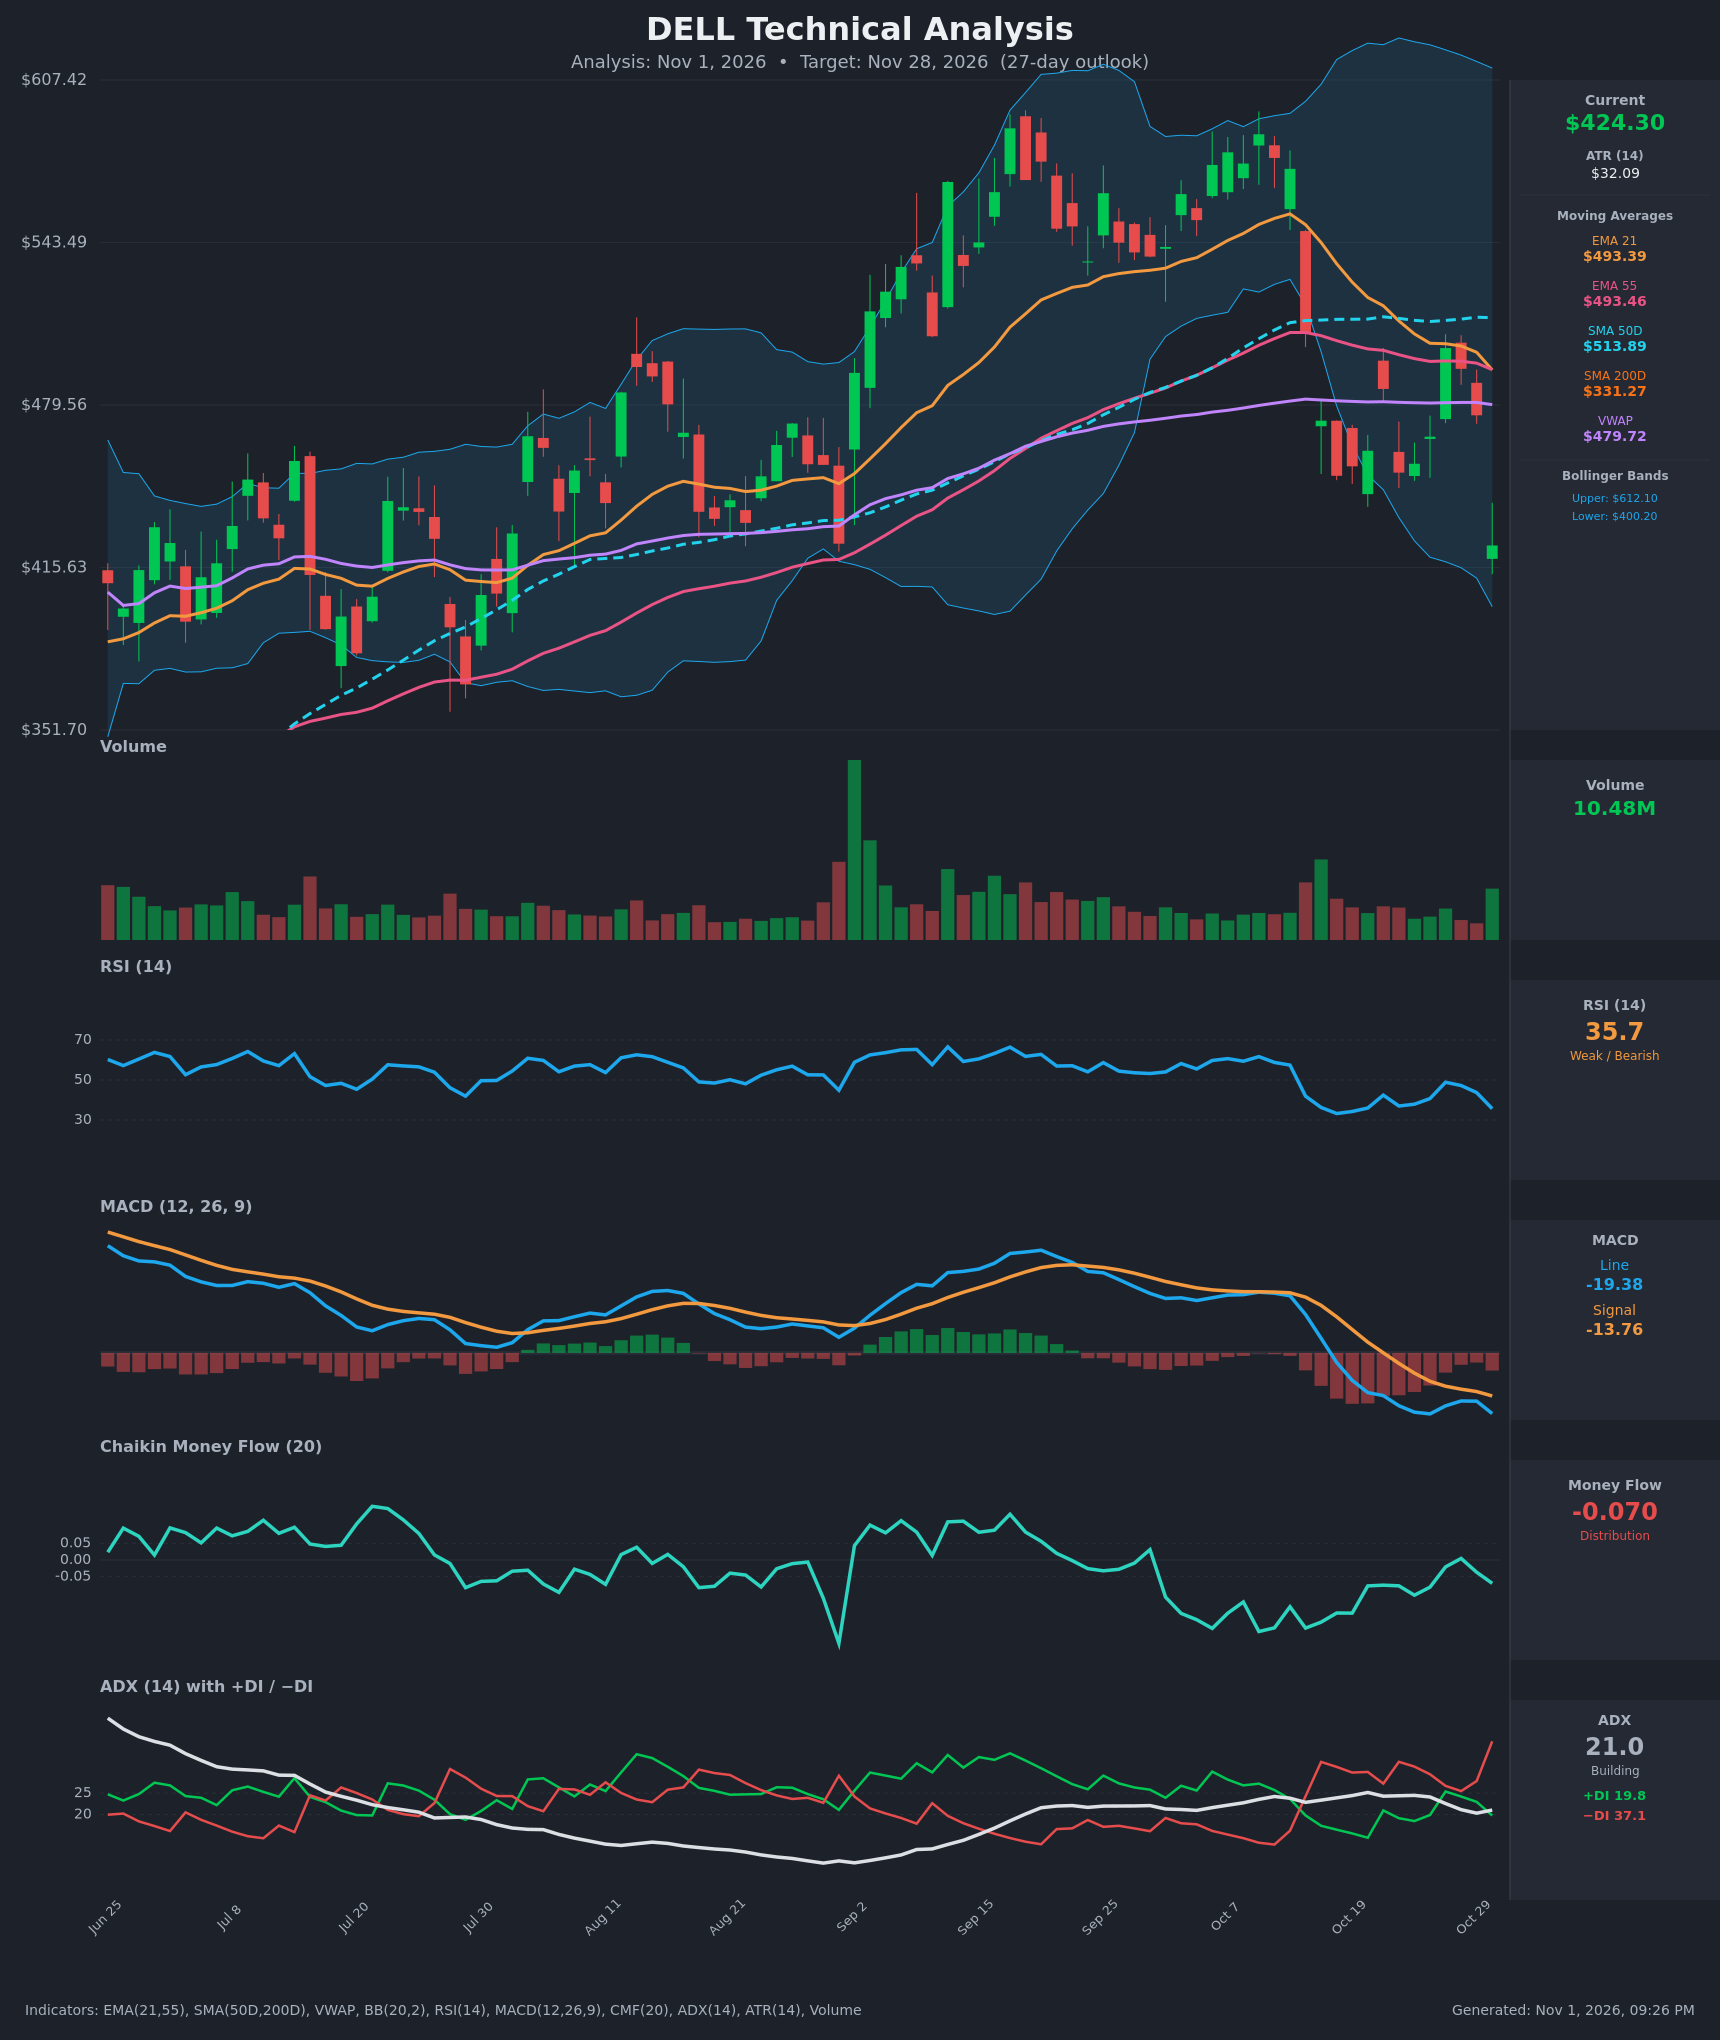
Analysis
TECHNICAL INDICATORS
- RSI (14): 35.65, down from 48.9 on Oct 27 and approaching oversold (<30) but not there yet. The Oct 16 low was 33.2, so momentum is weak and still falling. [Bearish]
- 20 EMA (EMA 21): $493.39, with price at $424.30, about 14% below it. The EMA has rolled over from about $553 on Oct 13 and is now dynamic resistance. EMA21 just slipped below EMA55 ($493.46), a fresh bearish crossover. [Bearish]
- MACD: Line -19.39 is below signal -13.76, so the histogram is about -5.6 and widening again. The line crossed below signal on Oct 16 and below zero the same day, and it is making new lows after a brief stall. [Bearish]
- Bollinger Bands (20): Upper $612.10, lower $400.20, and the bands are very wide after the volatile rally. Price sits in the lower part of the band (%B ≈ 0.11), about $24 above the lower band. The bands are starting to turn down and price is walking toward the lower band. This is stretched, but not yet a close outside the band. [Bearish]
- CMF (20): -0.070, below the -0.05 threshold. It has been mostly negative since early October, with only a brief flicker to +0.005 on Oct 28. Distribution is persistent. [Distribution]
- ADX (14): 21.0, with −DI 37.1 well above +DI 19.8. The trend is not yet strong (ADX is near 20-25), but −DI just spiked from 27.8 to 37.1, and ADX is turning up from 20.3. Sellers are firmly in control. [Weak but Strengthening Trend – Bearish]
- Volume: 10.48M, moderate compared with the heavy spike days in September and mid-October. A 10.7% single-day drop on only average volume suggests selling is orderly rather than capitulative, so there is no clear exhaustion yet. [Neutral-to-Bearish: no capitulation signal]
DIVERGENCES & TRENDS
- No bullish RSI or MACD divergence yet. Price made a lower low ($424 vs $451 on Oct 16), and RSI (35.7 vs 33.2) is only slightly higher. This is a mild, unconfirmed hint of a bounce, not a signal.
- Lower highs: price peaked near $577 on Oct 12, then $502 on Oct 27, and the Oct 28 close of $494 was lower still. Downside momentum is intact.
- Crossovers: EMA21 has crossed below EMA55 (bearish). MACD is bearish below zero. −DI has been above +DI since Oct 14.
- Moving averages: price is below EMA21, EMA55, SMA50D ($513.89) and VWAP ($479.72), which now stack overhead as resistance. Price remains above SMA200D ($331.27), so the long-term uptrend is intact. SMA50D is still well above SMA200D, so there is no death cross, but the gap is large and a deeper mean reversion toward the long-term average is possible.
- Gap and range: the Oct 14 gap-down (-11%) and the Oct 30 drop (-10.8%) both broke support, so the stock has stair-stepped lower.
CHART PATTERNS
- Bearish Double Top (reference diagram): peaks near $585-590 in mid-September and mid-October. The breakdown below the intervening trough completed the pattern, which is a reversal signal.
- Rectangle/Bearish Flag-style consolidation breakdown: from Oct 16 to Oct 29, price ranged between about $452 and $502 below the broken EMAs. The Oct 30 close at $424.30 is a break below the $452 floor. The measured move (about $50 height) projects to about $400-405. That lines up closely with the lower Bollinger Band ($400.20).
- Counter-signal: the price is near the lower band and RSI is nearing oversold, so a relief bounce is a real possibility. That would likely stall at the broken $452-467 area.
POTENTIAL SCENARIOS
- Scenario 1: Bearish Breakdown Continuation — The consolidation breakdown follows through toward the measured-move target and the lower Bollinger Band, with sellers (−DI 37) dominating and CMF in distribution. Trigger: daily close below $415, then $400. Target: $400 first, then $380-385. Invalidation: daily close back above $455. (50% probability)
- Scenario 2: Bullish Oversold Relief Bounce — RSI approaches 30, price is stretched near the lower band, and a short-covering bounce retraces part of the drop. Trigger: close above $452 with improving CMF (>0). Target: $455-470 (the prior range), where EMA21/55 resistance is still far overhead. Invalidation: close below $400. (30% probability)
- Scenario 3: Neutral Sideways Basing — Price chops between the $400 lower band and about $455 for most of the month as ADX stays low. Trigger: failure to break either $400 or $455. Target: $410-440. Invalidation: close outside either boundary. (20% probability)
PRICE TARGETS
- Target Price: $405.00 (27-day horizon)
- Expected Range: $372.00 to $440.00 (width $68, about 16% of current price, consistent with the 12-18% guidance for 27 days)
- Key Levels: Support at $400.20 (lower Bollinger Band / measured-move area), Resistance at $452.00 (prior range floor and broken support, with $467 above it)
OVERALL BIAS
OVERALL BIAS: BEARISH - Price has broken down below its recent consolidation, with a completed double top, a fresh EMA21/55 bearish cross, a MACD line below its signal and zero, −DI far above +DI, and persistent distribution on CMF. Oversold conditions raise the risk of a relief bounce, but the stronger evidence points to a drift toward $400 or slightly lower.
This is educational analysis and not financial advice.