ORCL 27-day bearish forecast — Nov 1, 2026
- Bias: Bearish
- Timeframe: 27 days (made Nov 1, 2026, target date Nov 27, 2026)
- Price at analysis: $130.67
- Price target: $127.00
- Expected range: $114.50 – $138.00
- Result: Pending — graded after the close on Nov 27, 2026
Get a free AI analysis of ORCL today
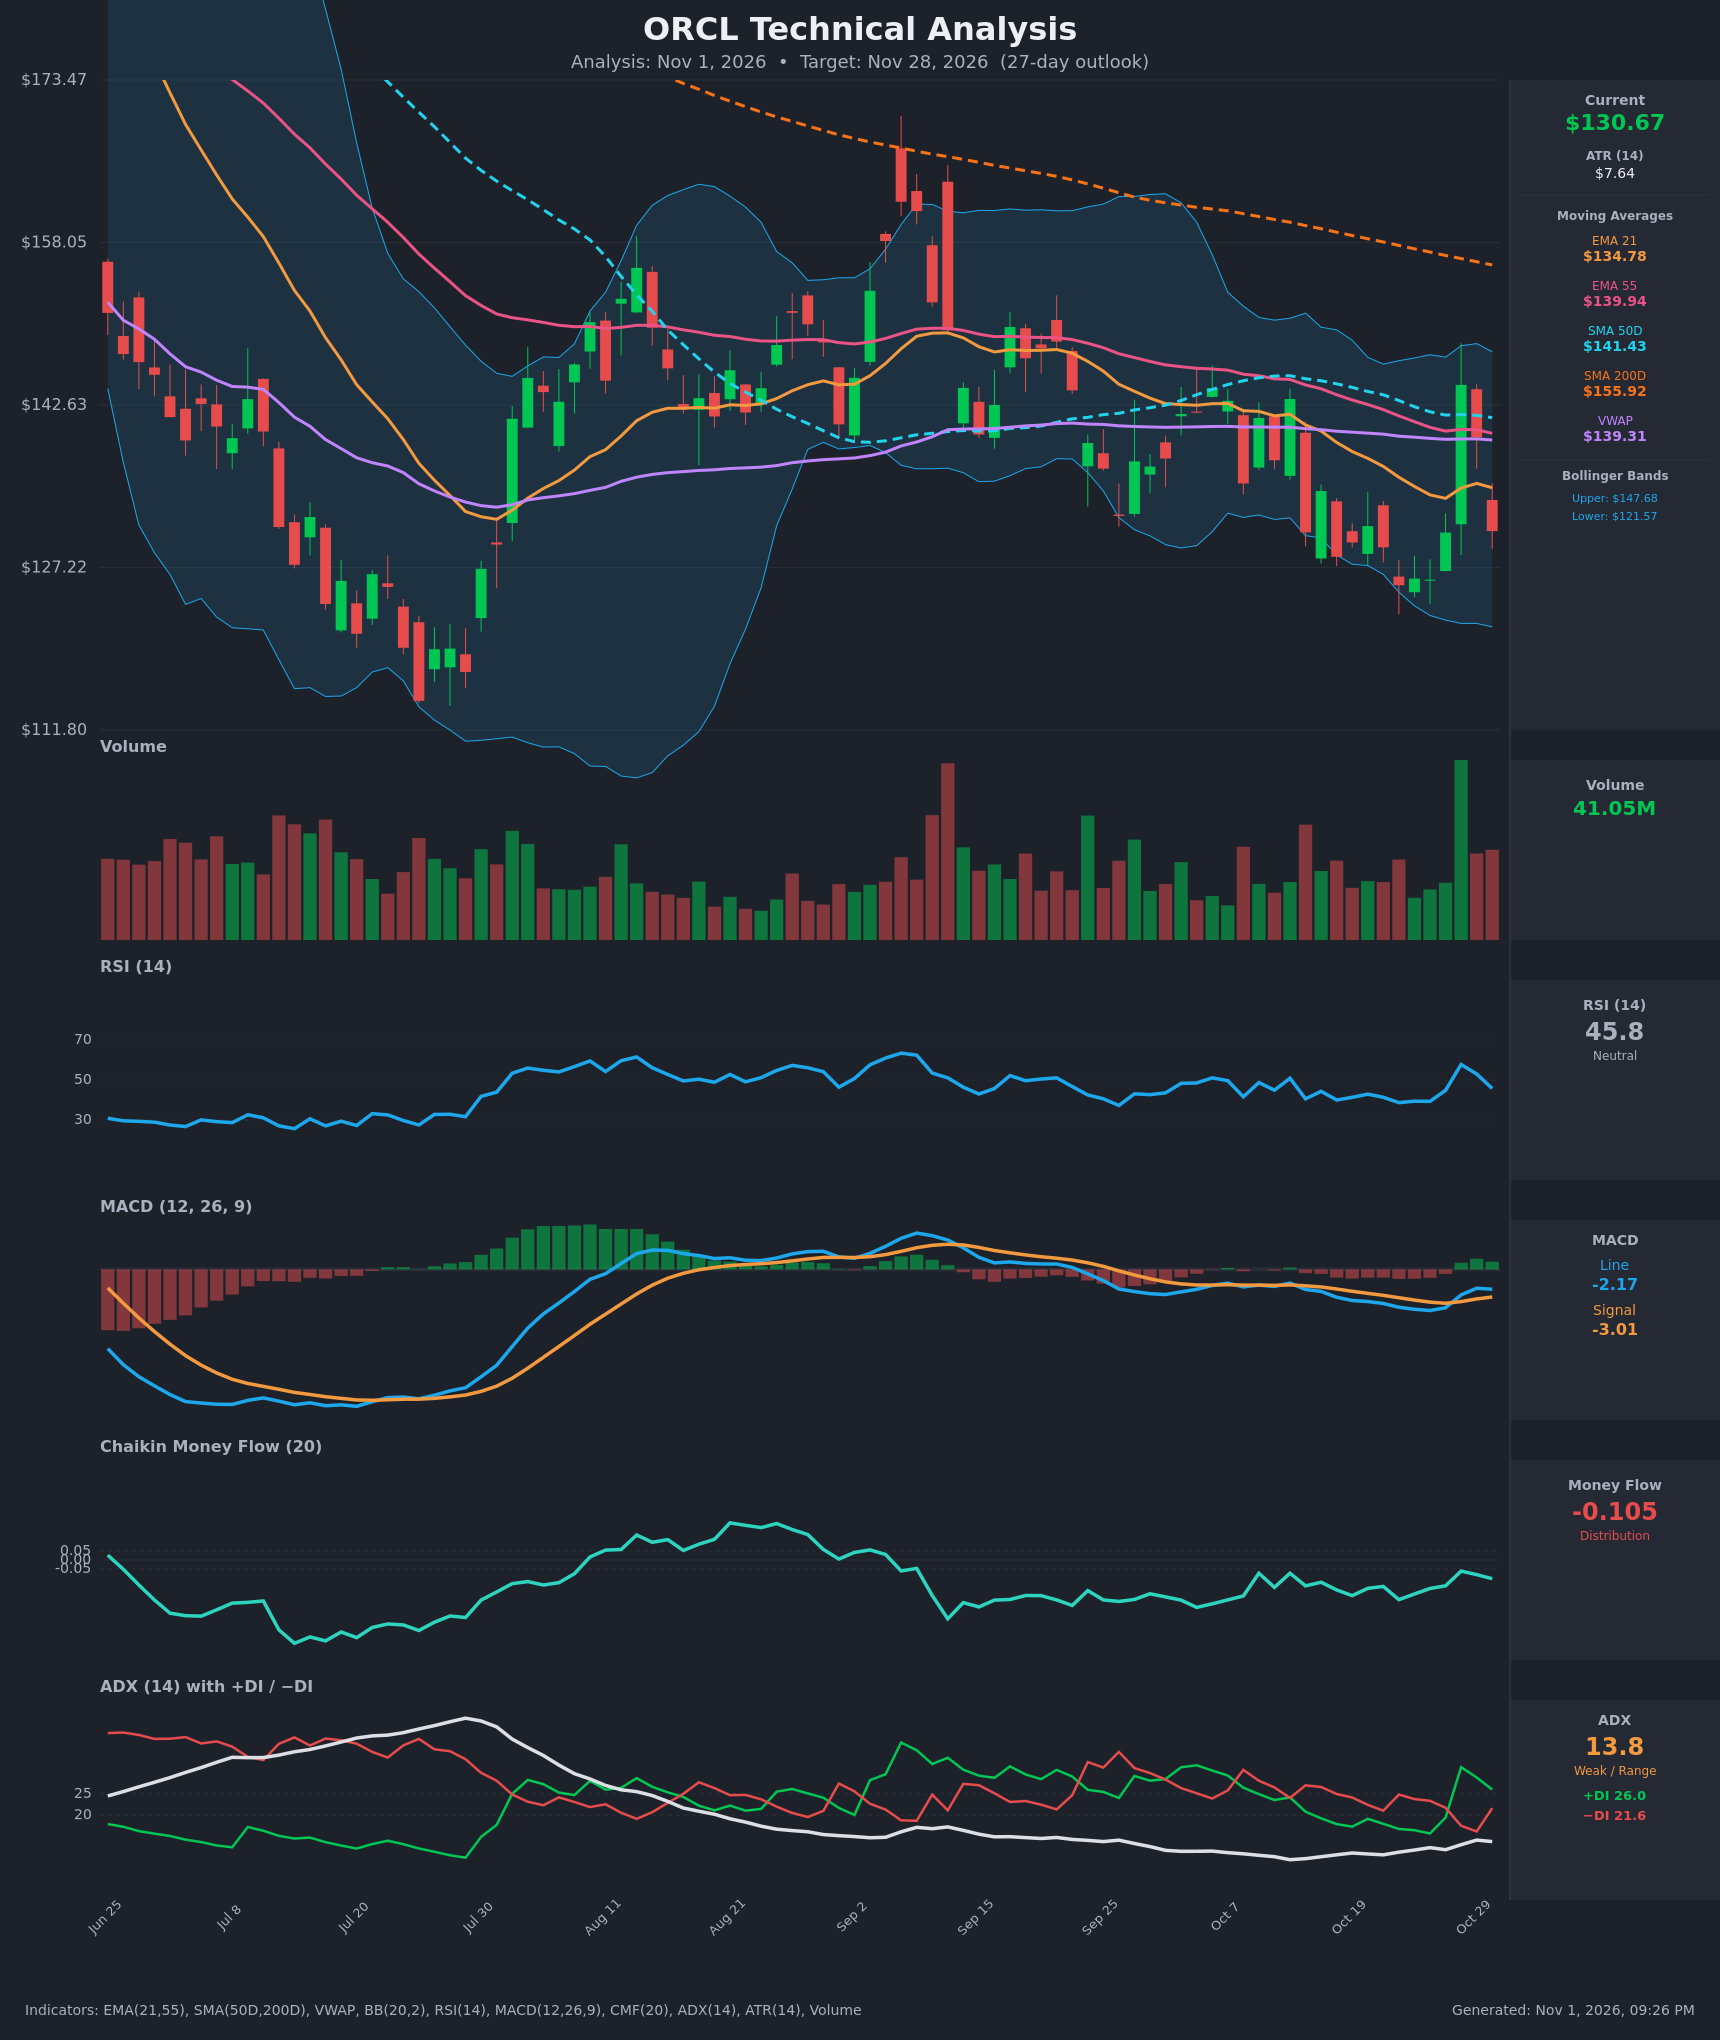
Analysis
TECHNICAL INDICATORS
- RSI (14): 45.76, below the 50 midline after peaking at 57.8 on the Oct 28 spike. It has been rolling over for two sessions (57.8 → 53.0 → 45.8). It is not oversold, and the recent low was 38.7. [Bearish]
- 20 EMA: The 21 EMA is $134.78 and price at $130.67 is below it, so it acts as resistance. The EMA21 is below the EMA55 ($139.94) and falling, a bearish stack. Price failed to hold above it after the Oct 28 spike. [Bearish]
- MACD: The MACD line is -2.17 and the signal is -3.01, so the line is above the signal and the histogram is slightly positive (+0.85). This is a minor bullish crossover that began on Oct 28, but both lines are below zero, and the MACD line has flattened (-2.79, -2.06, -2.17). [Neutral]
- Bollinger Bands (20): The bands run from $121.57 to $147.68 with a midline near $134.6. Price sits in the lower half, and the Oct 28 spike to $144.54 was rejected before reaching the upper band. The bands are moderately wide, which suggests range behavior with a downward bias. [Bearish]
- CMF (20): -0.105, below the -0.05 threshold. It has been negative for the whole recent stretch, ranging from -0.06 to -0.22, which means persistent distribution. [Distribution]
- ADX (14): 13.8 is very weak, so there is no established trend. +DI (26.0) is above −DI (21.6), but only because of the one-day spike on Oct 28, and −DI is rising again. The trend is not strong in either direction, but the +DI lead is fading. [Weak Trend, slight bullish tilt fading]
- Volume: 41.05M. The Oct 28 surge was a very high-volume green candle, the largest in the window, but it was followed by two red days that gave back the gains. That looks like a failed breakout or an exhaustion spike rather than sustained accumulation. [Bearish-leaning / Distribution]
DIVERGENCES & TRENDS
- Moving averages: Price ($130.67) is below the EMA21, EMA55, SMA50D ($141.43), SMA200D ($155.92) and VWAP ($139.31). The SMA50D is below the SMA200D (a death cross already in place), and the SMA200D is still falling. The long-term trend is firmly down.
- MACD vs. price: The MACD line has been basing around -4 to -2 while price makes lower lows ($125.54 on Oct 22), a mild bullish divergence. The bounce failed at the EMA21/EMA55 area, which limits its significance.
- CMF: It has stayed negative with no meaningful uptick, so the volume flow does not confirm any bounce.
- ADX: At 13.8 it is trendless. The market is in a choppy, range-like decline, and the −DI is turning up again.
- Key event: The Oct 28 spike (+10.7%) was fully retraced by Oct 30. The high-volume reversal is a bull trap, which is a bearish signal.
CHART PATTERNS
- Bearish Rising Wedge / Bearish Flag (loosely): The Oct 28 bounce is a failed rally within a downtrend, resembling a bearish continuation after the weak rebound.
- Range structure: Price has been oscillating between roughly $125 and $145 since late September, with a lower-high sequence (the Sep 8 peak near $167, then about $150, then $144.54). That is a descending-triangle-like or lower-high structure with horizontal support near $125–126 (tested Oct 22–26).
- Descending Triangle: If support at about $125 breaks, the measured move points toward roughly $112–115, which is the prior low zone shown on the chart. The pattern is not fully confirmed, since the lows have been flat-ish rather than a clean horizontal line.
- Bull case: A base near $125 plus the MACD cross could produce a bounce toward the EMA55 and SMA50D at about $140–141.
POTENTIAL SCENARIOS
- Scenario 1: Bearish Failed Bounce and Support Retest — The Oct 28 spike was rejected at the EMA55, and distribution (CMF -0.105) continues. Price retests the $125–126 support and may break below. Trigger: close below $125.50 or failure to reclaim the EMA21 ($134.78). Target: $120–123, with an extension to $115. Invalidation: daily close above $141.5 (SMA50D). (50% probability)
- Scenario 2: Neutral Range Chop — With ADX at 13.8, price oscillates between $125 and $140. Trigger: holds above $125.5 with no volume breakout. Target: $128–136. Invalidation: close outside $124–142. (30% probability)
- Scenario 3: Bullish Relief Rally — The MACD cross and the high-volume Oct 28 interest lead to a push back toward the moving-average cluster. Trigger: close above $135 with CMF turning positive. Target: $140–142. Invalidation: close below $125. (20% probability)
PRICE TARGETS
- Target Price: $127.00 (27 days)
- Expected Range: $114.50 to $138.00 (width $23.50 ≈ 18% of current price, consistent with the 30–60 day guidance, and about 1.5x ATR-scaled over a 27-day horizon)
- Key Levels: Support at $125.50, Resistance at $134.78
OVERALL BIAS
OVERALL BIAS: BEARISH - Price is below every major moving average (including a death cross with the SMA50D under the SMA200D), CMF shows persistent distribution at -0.105, and the Oct 28 high-volume spike was fully retraced, which marks a failed rally. The slightly positive MACD histogram and weak ADX limit conviction, but the weight of evidence favors a drift toward the $125 support zone or lower.
This is educational analysis and not financial advice.