NFLX 27-day bearish forecast — Nov 1, 2026
- Bias: Bearish
- Timeframe: 27 days (made Nov 1, 2026, target date Nov 27, 2026)
- Price at analysis: $62.08
- Price target: $59.50
- Expected range: $53.00 – $67.00
- Result: Pending — graded after the close on Nov 27, 2026
Get a free AI analysis of NFLX today
Analysis
TECHNICAL INDICATORS
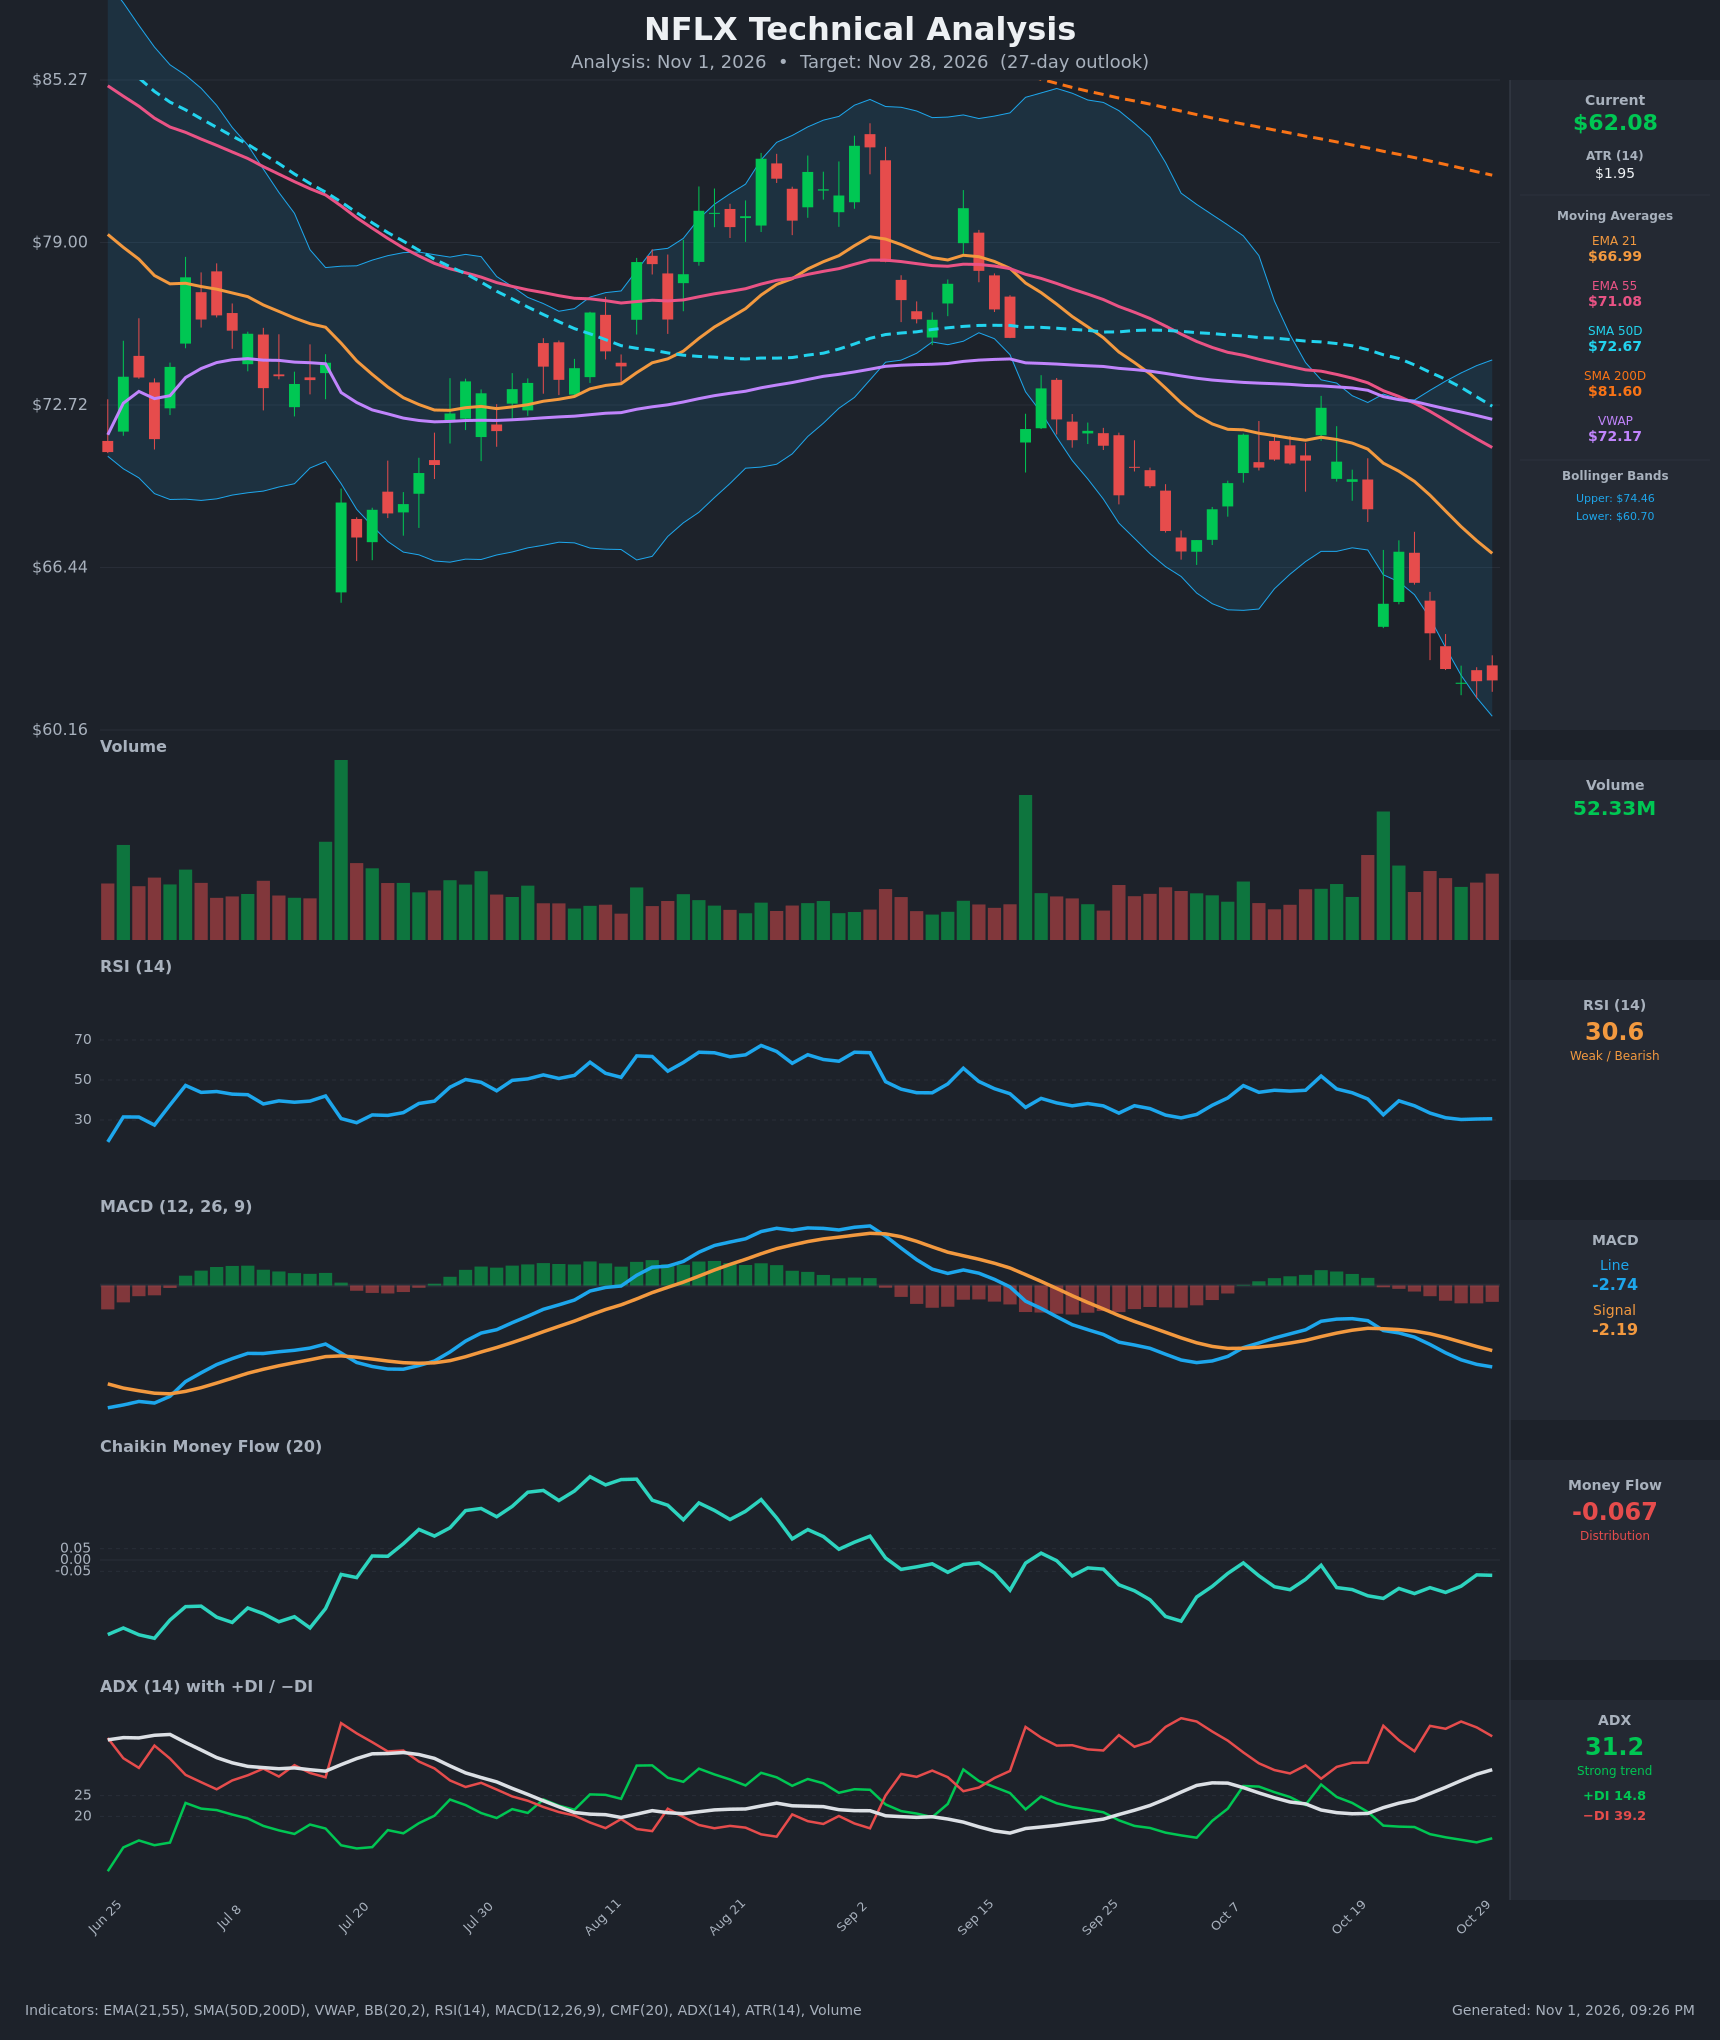
- RSI (14): 30.62, hovering at the oversold threshold after sliding from 52 on Oct 15. It has been pinned at 30-31 for four sessions, so downside momentum is stalling but there is no bullish turn yet. [Bearish]
- 20 EMA: The 21 EMA is $66.99, about 7.9% above price at $62.08. It has been falling steadily and sits above the market, so it acts as overhead resistance. EMA21 is also below EMA55 ($71.08), a bearish stack. [Bearish]
- MACD: The line is -2.74, below the signal at -2.19. The bearish crossover occurred around Oct 21 and the gap is widening, with a negative and expanding histogram. There is no sign of a momentum turn. [Bearish]
- Bollinger Bands (20): The bands run from $60.70 to $74.46. Price at $62.08 is in the lower 10% of the range and has been riding the lower band, which is a sign of trend strength. The bands are expanding after the sell-off. A bounce toward the $67-68 mid-band is possible, but a band walk is more likely. [Bearish]
- CMF (20): -0.067, below the -0.05 threshold. It is hovering near the threshold rather than deepening, so distribution is mild but persistent. [Distribution]
- ADX (14): 31.2 and rising, with −DI (39.2) far above +DI (14.8). This is a strong, established downtrend with bears firmly in control. [Strong Trend – Bearish]
- Volume: 52.33M, elevated. Recent down days have carried above-average volume, including the Oct 26-30 breakdown, which suggests persistent selling. There is no capitulation spike yet, so a washout low is not confirmed. [Bearish – selling pressure]
DIVERGENCES & TRENDS
- No bullish divergence yet: Price made new lows from $65 to $62, and RSI roughly matched (32.6 → 30.6), so there is no clear divergence. RSI is flat while price drifts lower, a mild sign of selling exhaustion.
- Moving-average structure: Price is below EMA21, EMA55, SMA50D ($72.67), VWAP ($72.17) and SMA200D ($81.60). SMA50D is below SMA200D, so the death cross is already in place. Every moving average is sloping down.
- MACD: It crossed below signal and is accelerating lower. Both lines are below zero.
- ADX/DI: −DI crossed above +DI in mid-October and the gap has widened, with ADX climbing from 20.6 to 31.2. The trend is strengthening.
- CMF: It has gone from positive in August to negative and is now near the distribution threshold.
CHART PATTERNS
- Bearish Rising Wedge / Double Top (reversal): The June-September advance to about $83 formed a rounded top, and the subsequent break below the 50D and 200D averages completed the reversal.
- Continuation: The lower highs since September (about $75 → $72.6 → $70.5) and a steady staircase of lower lows resemble a Bearish Flag/Descending channel. The measured move from the rally-to-breakdown legs points to the high-$50s.
- Support: The $60.16 chart low and the $60.70 lower band are the immediate floor. A close below them opens $57-58. The only bullish counter-pattern would be a Falling Wedge or Double Bottom, and neither is confirmed.
POTENTIAL SCENARIOS
- Scenario 1: Bearish Trend Continuation — Price breaks the $60.16-60.70 support zone and keeps walking the lower band with −DI dominant. Trigger: daily close below $60.16. Target: $56.50-58.00. Invalidation: close above EMA21 at about $67. (50% probability)
- Scenario 2: Neutral/Bearish Oversold Bounce and Fade — RSI at 30 triggers a relief rally to the lower-mid band and the declining EMA21, which then rejects. Trigger: reclaim of $64.50 on rising volume. Target: $66-67, then rollover to about $62. Invalidation: close above $68.50. (30% probability)
- Scenario 3: Bullish Reversal — Capitulation volume forms a base, MACD histogram turns up, and price recovers toward the EMA55. Trigger: close above $67 with RSI above 45 and a MACD cross. Target: $70-71. Invalidation: fall back below $60.70. (20% probability)
PRICE TARGETS
- Target Price: $59.50 (27-day)
- Expected Range: $53.00 to $67.00 (width $14.00 ≈ 22.6% of the current price, consistent with the 30-60 day guideline scaled to a 27-day horizon; ATR $1.95 × √27 ≈ $10 supports a wide band)
- Key Levels: Support at $60.16, Resistance at $66.99
OVERALL BIAS
OVERALL BIAS: BEARISH - Strong downtrend with ADX at 31 and −DI far above +DI, a death cross in place, price below every moving average, and a widening bearish MACD gap with persistent distribution. RSI at 30 raises the odds of a relief bounce, but with no divergence or reversal signal, the path of least resistance remains lower.
This is educational analysis and not financial advice.