NOK 27-day bearish forecast — Nov 1, 2026
- Bias: Bearish
- Timeframe: 27 days (made Nov 1, 2026, target date Nov 27, 2026)
- Price at analysis: $8.56
- Price target: $8.05
- Expected range: $7.25 – $8.95
- Result: Pending — graded after the close on Nov 27, 2026
Get a free AI analysis of NOK today
Analysis
TECHNICAL INDICATORS
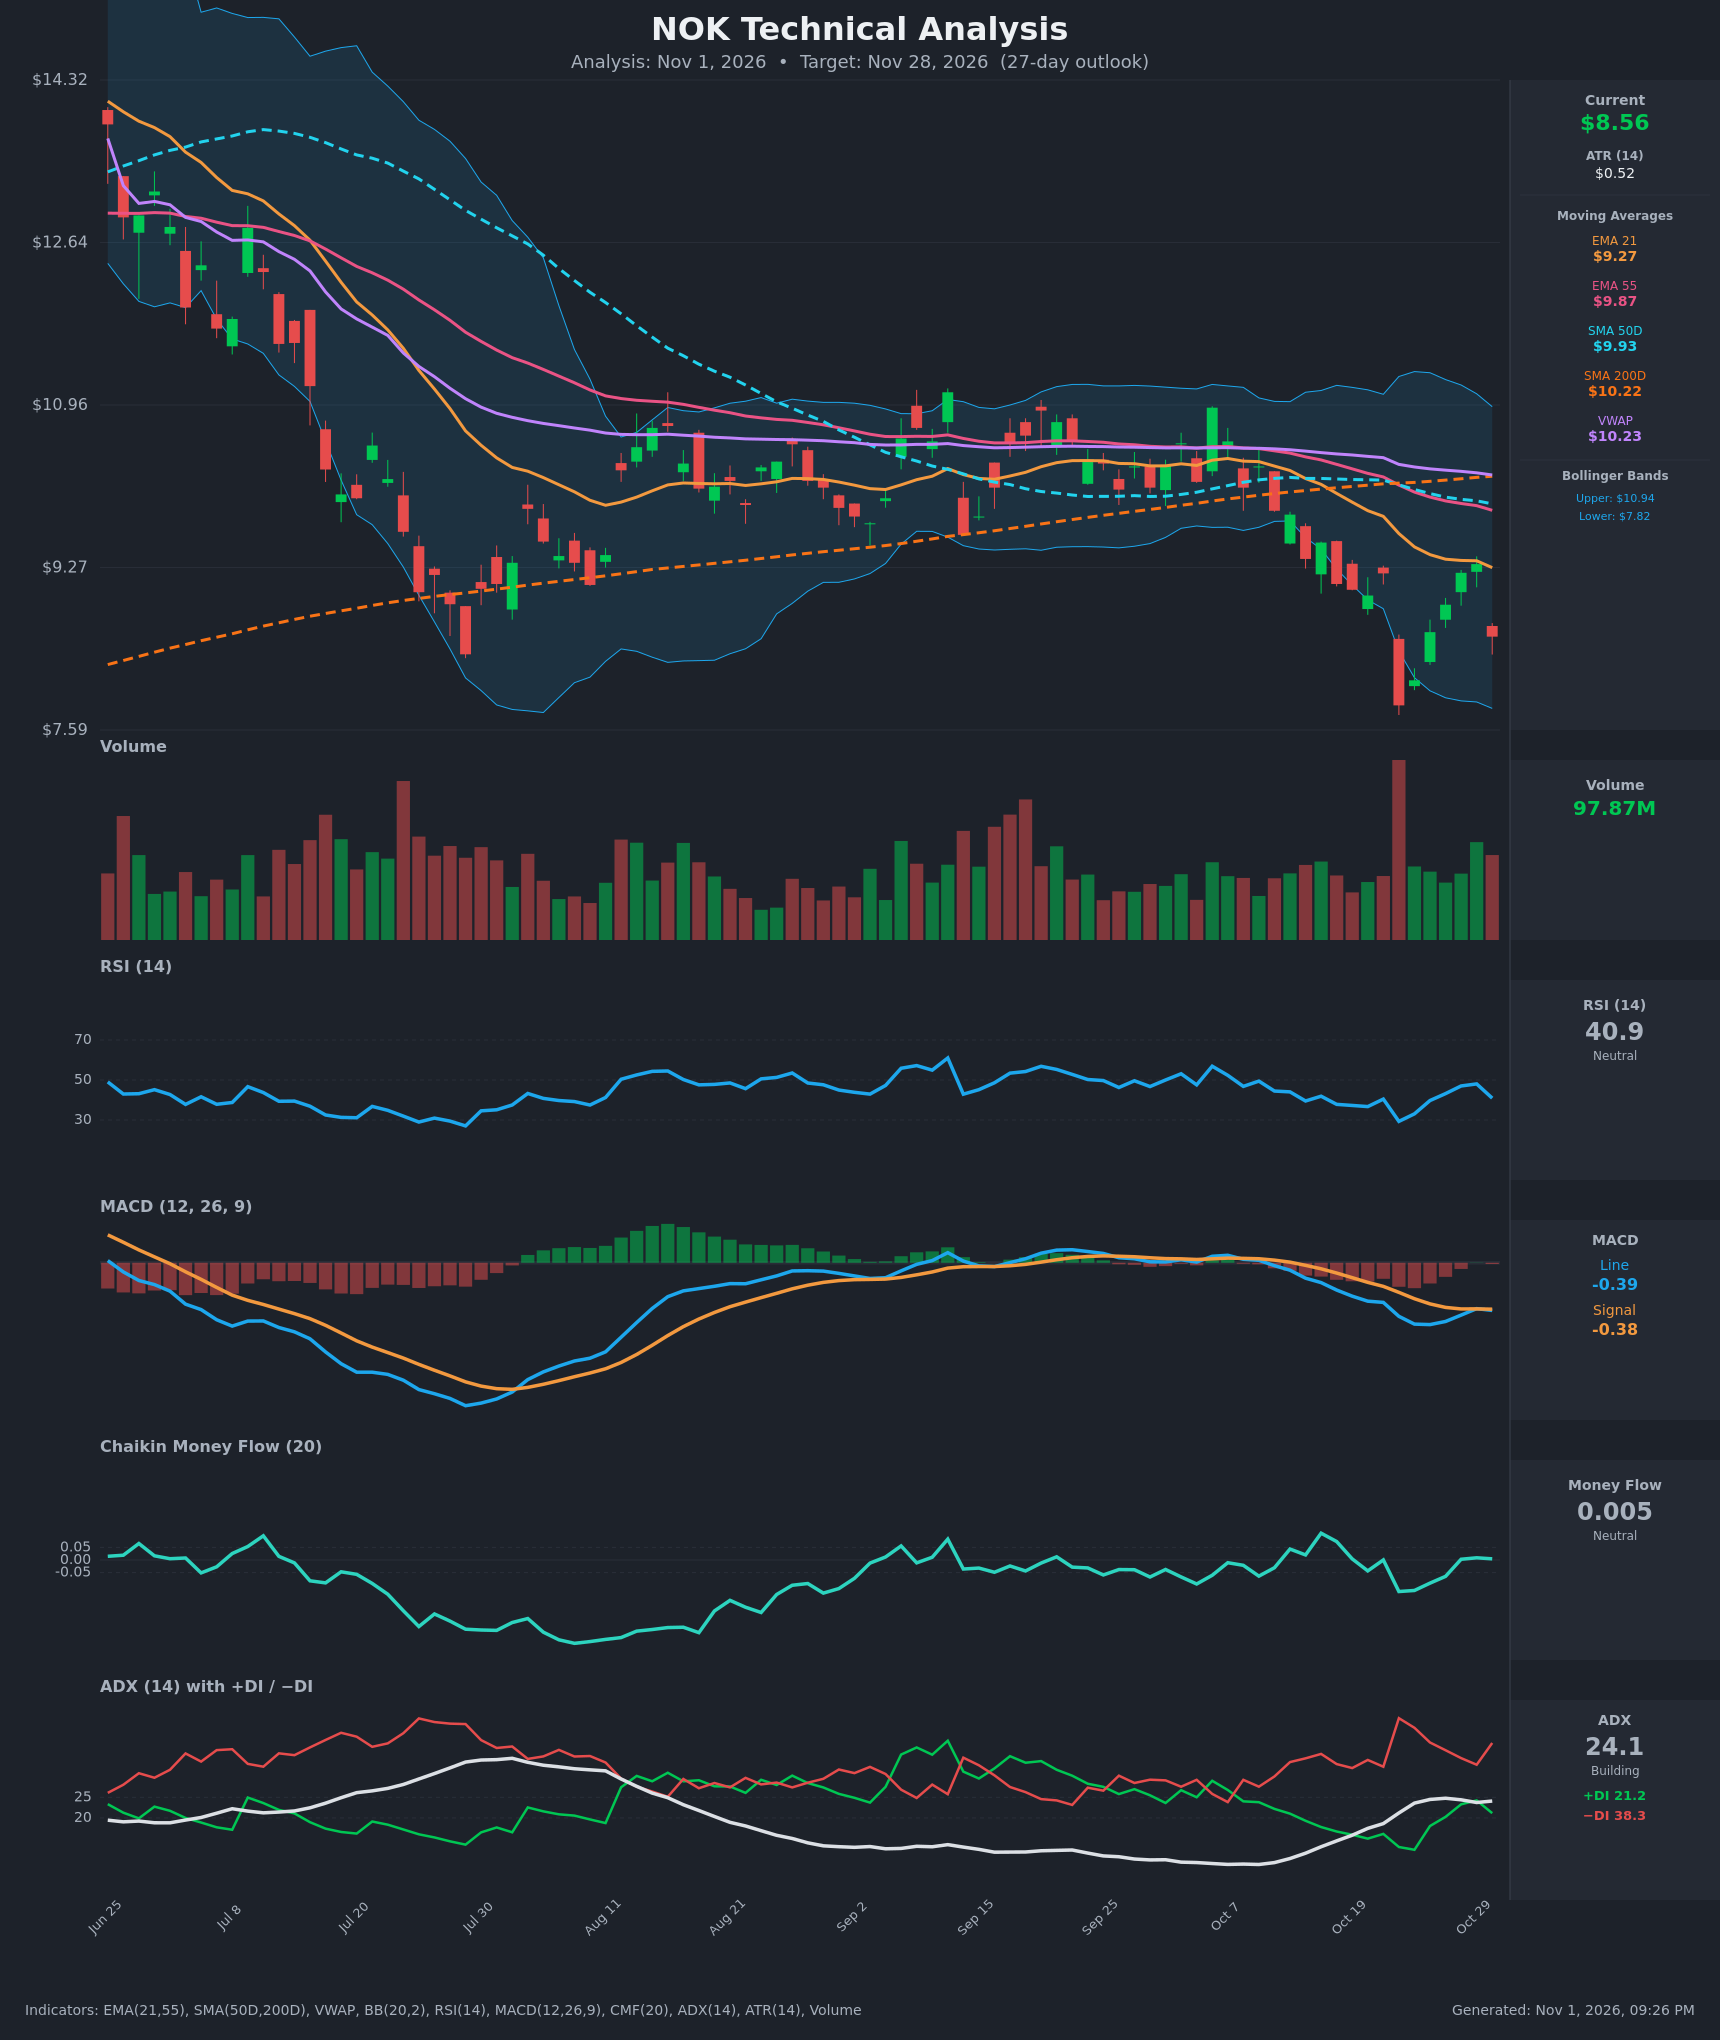
- RSI (14): 40.93, down from 48.0 on Oct 29 after the sharp drop on Oct 30. It is below 50 but not oversold (the Oct 22 low was 29.3). Momentum is weak with a bearish tilt. [Bearish]
- 20 EMA (EMA 21): $9.27. Price at $8.56 is about 7.7% below it, and the EMA is sloping down. It acts as overhead resistance. EMA21 is also below EMA55 ($9.87), a bearish alignment. [Bearish]
- MACD: Line -0.386 vs. Signal -0.376. The line has just crossed back below the signal after a brief bullish attempt, so the histogram is marginally negative. Both lines are below zero. [Bearish]
- Bollinger Bands (20): Upper $10.94, lower $7.82, so the midline is about $9.38. Price at $8.56 sits in the lower third, well off the Oct 22 band-touching flush. The bands are wide after the recent selloff, and a bounce toward the midline is possible but the trend is down. [Bearish]
- CMF (20): 0.005, between ±0.05, so flow is neutral. It has hovered around zero over recent sessions with no accumulation after the selloff. [Neutral]
- ADX (14): 24.1 and building, near the 25 trend-strength threshold. −DI at 38.3 is far above +DI at 21.2, so bears control. +DI had nearly crossed −DI on Oct 29 (24.3 vs. 33.0) before rolling over again. [Moderate Trend, Bearish]
- Volume: 97.87M on the Oct 30 red candle, above recent average levels but well below the Oct 22 capitulation spike. A heavy-volume rejection candle after a 5-bar bounce suggests sellers are active. [Bearish]
Other trend context:
- Price is below SMA50D ($9.93), SMA200D ($10.22) and VWAP ($10.23), a clear long-term downtrend.
- SMA50D is below SMA200D, so it sits in death-cross territory.
DIVERGENCES & TRENDS
- No clear bullish divergence: the Oct 22 low (RSI 29.3) was not followed by a lower price low with a higher RSI.
- RSI and MACD both made lower lows through October, confirming the decline.
- The Oct 23–29 bounce (from $7.85 to $9.31) stalled below EMA21 and was rejected on Oct 30 with a -8% candle. This is a classic failed relief rally.
- MACD re-crossed below its signal line on Oct 30 after nearly crossing up.
- −DI remains dominant and ADX is rising, so trend strength is increasing in the bearish direction.
- All moving averages are stacked bearishly: price < EMA21 < EMA55 < SMA50D < SMA200D.
- CMF near zero shows no meaningful accumulation to support a reversal.
CHART PATTERNS
- Bearish Pennant/Flag (continuation): The Oct 22 drop followed by the Oct 23–29 grind higher resembles a bear flag/dead-cat bounce under the declining EMA21. The Oct 30 rejection could be the start of the next leg down. The measured move from the Oct 22 drop (about $1.35 from $9.21 to $7.85) projected from a breakdown near $8.0–8.1 would point toward roughly $6.7–7.0, though that is a stretched target for 27 days.
- Range breakdown: From early August to mid-October price was consolidating in a $9.5–$10.9 range, which resolved lower (a bearish break of the range, similar to a Bearish Triple Top/rectangle breakdown). The range base around $9.3–9.5 now acts as resistance.
- Key near-term support is the Oct 22 low of about $7.85 (close) and the intraday low near $7.6. A close below it would confirm the continuation pattern.
POTENTIAL SCENARIOS
- Scenario 1: Bearish Continuation Lower — The failed bounce under EMA21 resolves into a retest and break of the October low. Trigger: close below $8.00–7.85 with expanding volume and MACD pressing deeper below zero. Target: $7.30–7.60, with an extension toward $7.00. Invalidation: daily close above $9.30 (EMA21). (55% probability)
- Scenario 2: Neutral Choppy Base — Price stabilizes above the $7.85 low and oscillates between $7.85 and $9.20 as the selloff digests. Trigger: ADX rolling over below 22 and RSI holding 38–50. Target: $8.30–$8.90. Invalidation: close outside $7.80–$9.30. (25% probability)
- Scenario 3: Bullish Relief Rally — Oversold bounce toward the Bollinger midline and EMA21 supported by a positive MACD cross. Trigger: close above $9.31 (last bounce high) with CMF above +0.05. Target: $9.30–$9.90 (EMA21/EMA55). Invalidation: loss of $8.00. (20% probability)
PRICE TARGETS
For the 27-day timeframe (a 30–60 day style range of ~12–18% of price; width ≈ $1.45, or 17%):
- Target Price: $8.05 (about -6% from $8.56; consistent with a bearish continuation, tempered by oversold bounces)
- Expected Range: $7.25 to $8.95 (width $1.70 ≈ 19.9%, slightly wider to account for ATR of $0.52 and recent volatility, about 17–18% would be tighter, so treat the upper end as a soft cap)
- Key Levels: Support at $7.85, Resistance at $9.27
Self-check: $8.95 − $7.25 = $1.70, which is 19.9% of $8.56. This is a little above the 12–18% guide but justified by the high-volatility setup (ATR ≈ 6.1% of price and the recent -15% single-day drop).
OVERALL BIAS
OVERALL BIAS: BEARISH - Price is below every major moving average, −DI (38.3) dominates +DI (21.2) with ADX rising, MACD has re-crossed below its signal, and the recent bounce failed under EMA21 on heavy volume. Mixed CMF and a non-oversold RSI limit the downside pace, but the path of least resistance points to a retest of the $7.85 low.
This is educational analysis and not financial advice.