NBIS 27-day bearish forecast — Nov 1, 2026
- Bias: Bearish
- Timeframe: 27 days (made Nov 1, 2026, target date Nov 27, 2026)
- Price at analysis: $154.14
- Price target: $146.00
- Expected range: $135.00 – $157.00
- Result: Pending — graded after the close on Nov 27, 2026
Get a free AI analysis of NBIS today
Analysis
TECHNICAL INDICATORS
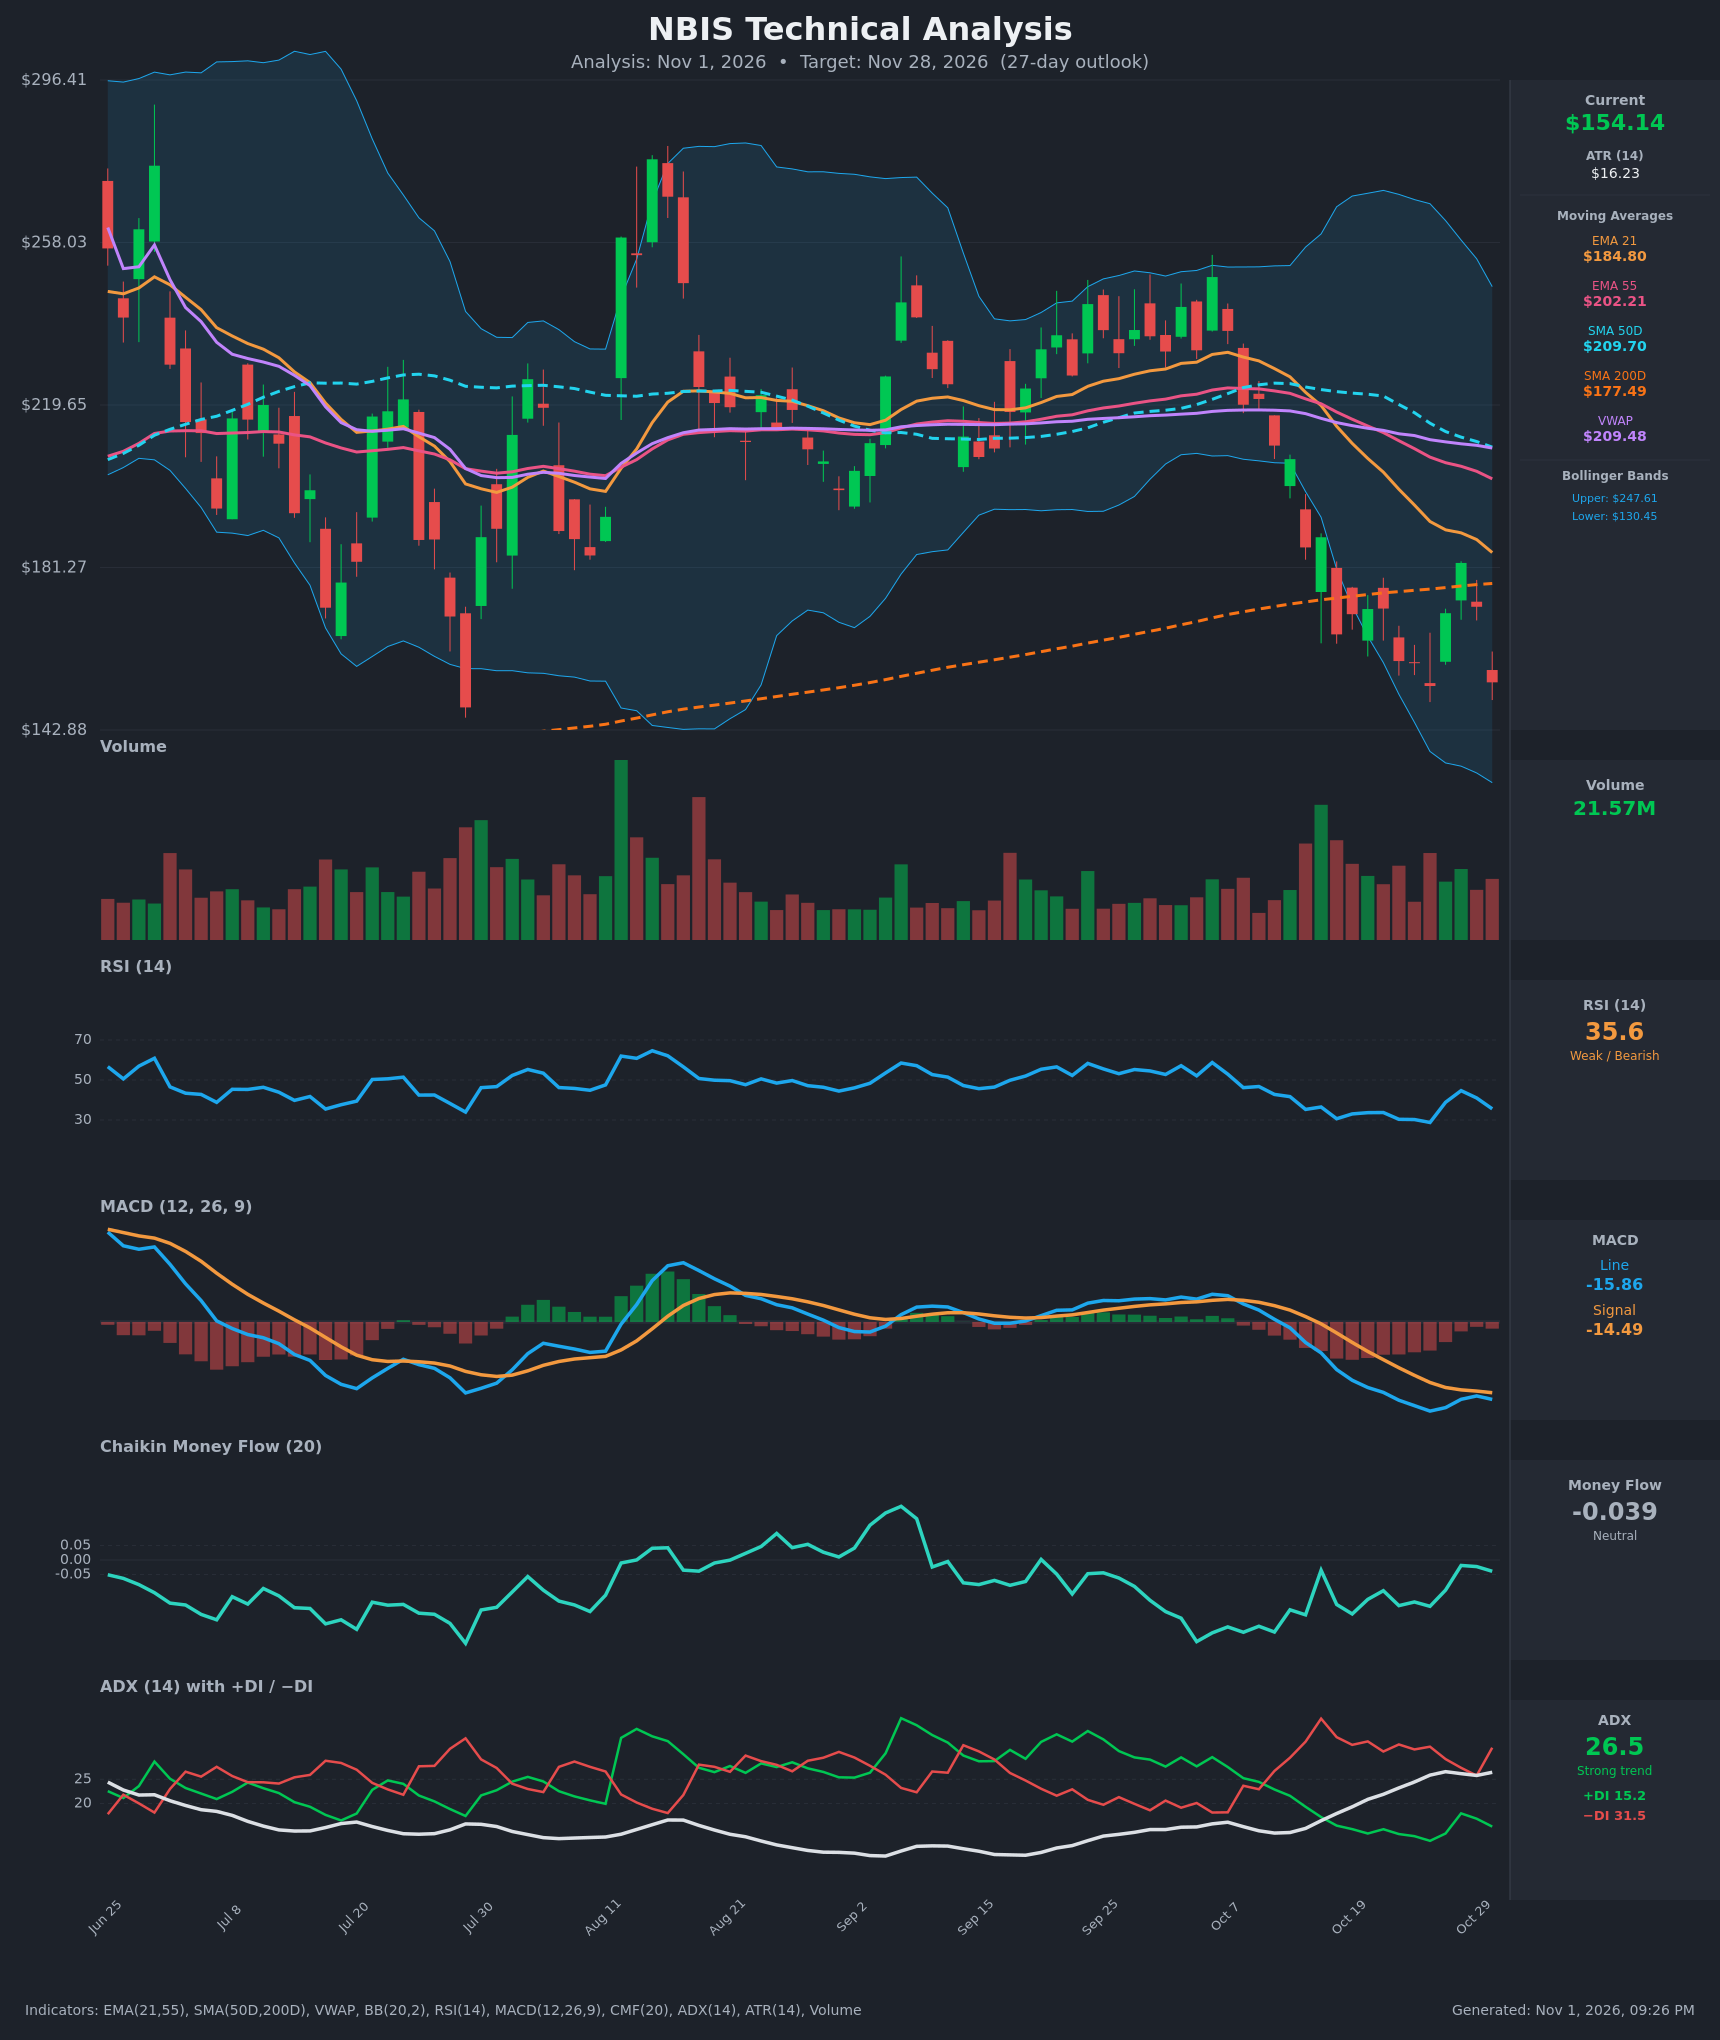
- RSI (14): 35.58, down from 44.7 on Oct 28 after a failed bounce. It is near the oversold zone but not yet below 30. It made a lower high on the bounce (44.7 vs. 50+ in September), so momentum is still pointed down. [Bearish]
- 20 EMA: The 21 EMA is $184.80 and price ($154.14) is about 16.6% below it, so it acts as overhead resistance. It has been falling steadily and crossed below the EMA55 ($202.21) around Oct 15. [Bearish]
- MACD: Line -15.86 is below signal -14.49, so the histogram is negative (about -1.37). The line was starting to curl up on Oct 27-29 (-18.25 to -15.15), but the Oct 30 selloff reversed that. The bounce failed to produce a bullish crossover. [Bearish]
- Bollinger Bands (20): Upper $247.61, lower $130.45, middle about $189. Price sits in the lower third of the bands, well below the midline. The bands are wide, so volatility is elevated. Price is not at the lower band, so there is further room to fall before a band-based oversold signal. [Bearish]
- CMF (20): -0.039, in the neutral zone (between -0.05 and +0.05). It has been mildly negative for weeks and has improved from -0.25 on Oct 12. Selling pressure is easing, but there is no accumulation. [Neutral]
- ADX (14): 26.5 and rising from 13.9 on Oct 12, so a strong trend has developed. −DI (31.5) is well above +DI (15.2), and the gap widened again on Oct 30. This is a clear downtrend. [Strong Trend – Bearish]
- Volume: 21.57M, roughly average. The big spikes in the chart sit on red candles during the October breakdown, so selling has carried more conviction than buying. The bounce to $182 had unremarkable volume. [Bearish bias / distribution on rallies]
DIVERGENCES & TRENDS
- There is no bullish RSI divergence yet. The Oct 26 low ($153.27) had RSI at 28.8, and today's similar price ($154.14) has RSI at 35.6. That is a mild higher RSI at an equal price low, but it is not confirmed.
- MACD is deeply negative and below its signal line, with the histogram expanding again.
- The EMA21 crossed below the EMA55 on about Oct 15, a bearish crossover that is still in force.
- Price lost the SMA200D ($177.49) on Oct 22-23 and has not reclaimed it. The failed bounce on Oct 28 (high $182.34) was rejected right at that level. SMA50D ($209.70) is still above SMA200D, so there is no death cross yet, but the spread is shrinking quickly.
- Price is far below VWAP ($209.48) and the SMA50D, so there is heavy overhead supply.
- DI spread: −DI above +DI since Oct 12, with ADX rising. That is a trend-continuation signal.
CHART PATTERNS
- Bearish Flag / Pennant (continuation): After the sharp drop from about $210 to $153, the bounce to about $182 and the rollover look like a bearish flag. A break below $153 would project roughly $135-$140.
- Possible Double Bottom (reversal, unconfirmed): Price is retesting the Oct 26 low of $153.27. If $153 holds and price breaks above the $182 peak, a Bullish Double Bottom would target about $210. It needs a close above $182 and is not confirmed.
- Descending Triangle bias: Lower highs ($210, $188, $182) against horizontal support near $153 lean bearish. A decisive close below $153 would trigger it.
- Overall, the pattern evidence leans toward the bearish continuation and favors a breakdown.
POTENTIAL SCENARIOS
- Scenario 1: Bearish Breakdown Continuation — Price loses the $153 retest low and the ADX/−DI trend continues, dragging price toward the lower Bollinger Band. Trigger: daily close below $153.27 on rising volume. Target: $135-$140, with a stretch toward $130.45. Invalidation: daily close back above $177.49 (SMA200D). (50% probability)
- Scenario 2: Bullish Relief Bounce / Double Bottom — Price holds $153, RSI turns up from near-oversold levels, and a mean-reversion bounce rallies into the $172-$185 area, where the EMA21 and SMA200D cap it. Trigger: close above $172 with a MACD histogram turn. Target: $177-$185. Invalidation: close below $150. (32% probability)
- Scenario 3: Neutral Range Chop — Price consolidates between $145 and $170 as selling pressure fades (CMF near zero) but no catalyst appears. Trigger: failure to break either $153 or $172. Target: about $155-$160. Invalidation: close outside $145-$172. (18% probability)
PRICE TARGETS
- Target Price: $146.00 (27-day outlook)
- Expected Range: $135.00 to $157.00 (width $22.00, about 14.3% of current price, which fits the 27-day scaling; ATR is high at about 10.5% of price)
- Key Levels: Support at $130.45 (lower Bollinger Band; the nearer $153.27 is the Oct 26 closing low), Resistance at $177.49 (SMA200D, with the EMA21 at $184.80 above it)
OVERALL BIAS
OVERALL BIAS: BEARISH - Price is below every major moving average, with a strong ADX trend (26.5) led by −DI (31.5 vs. 15.2). MACD is below its signal line and the failed bounce was rejected at the SMA200D. Conviction is modest because RSI is near oversold, CMF is neutral, and a relief bounce toward $177 is a real risk.
This is educational analysis and not financial advice.