PLTR 27-day bearish forecast — Nov 1, 2026
- Bias: Bearish
- Timeframe: 27 days (made Nov 1, 2026, target date Nov 27, 2026)
- Price at analysis: $184.11
- Price target: $177.50
- Expected range: $164.00 – $191.00
- Result: Pending — graded after the close on Nov 27, 2026
Get a free AI analysis of PLTR today
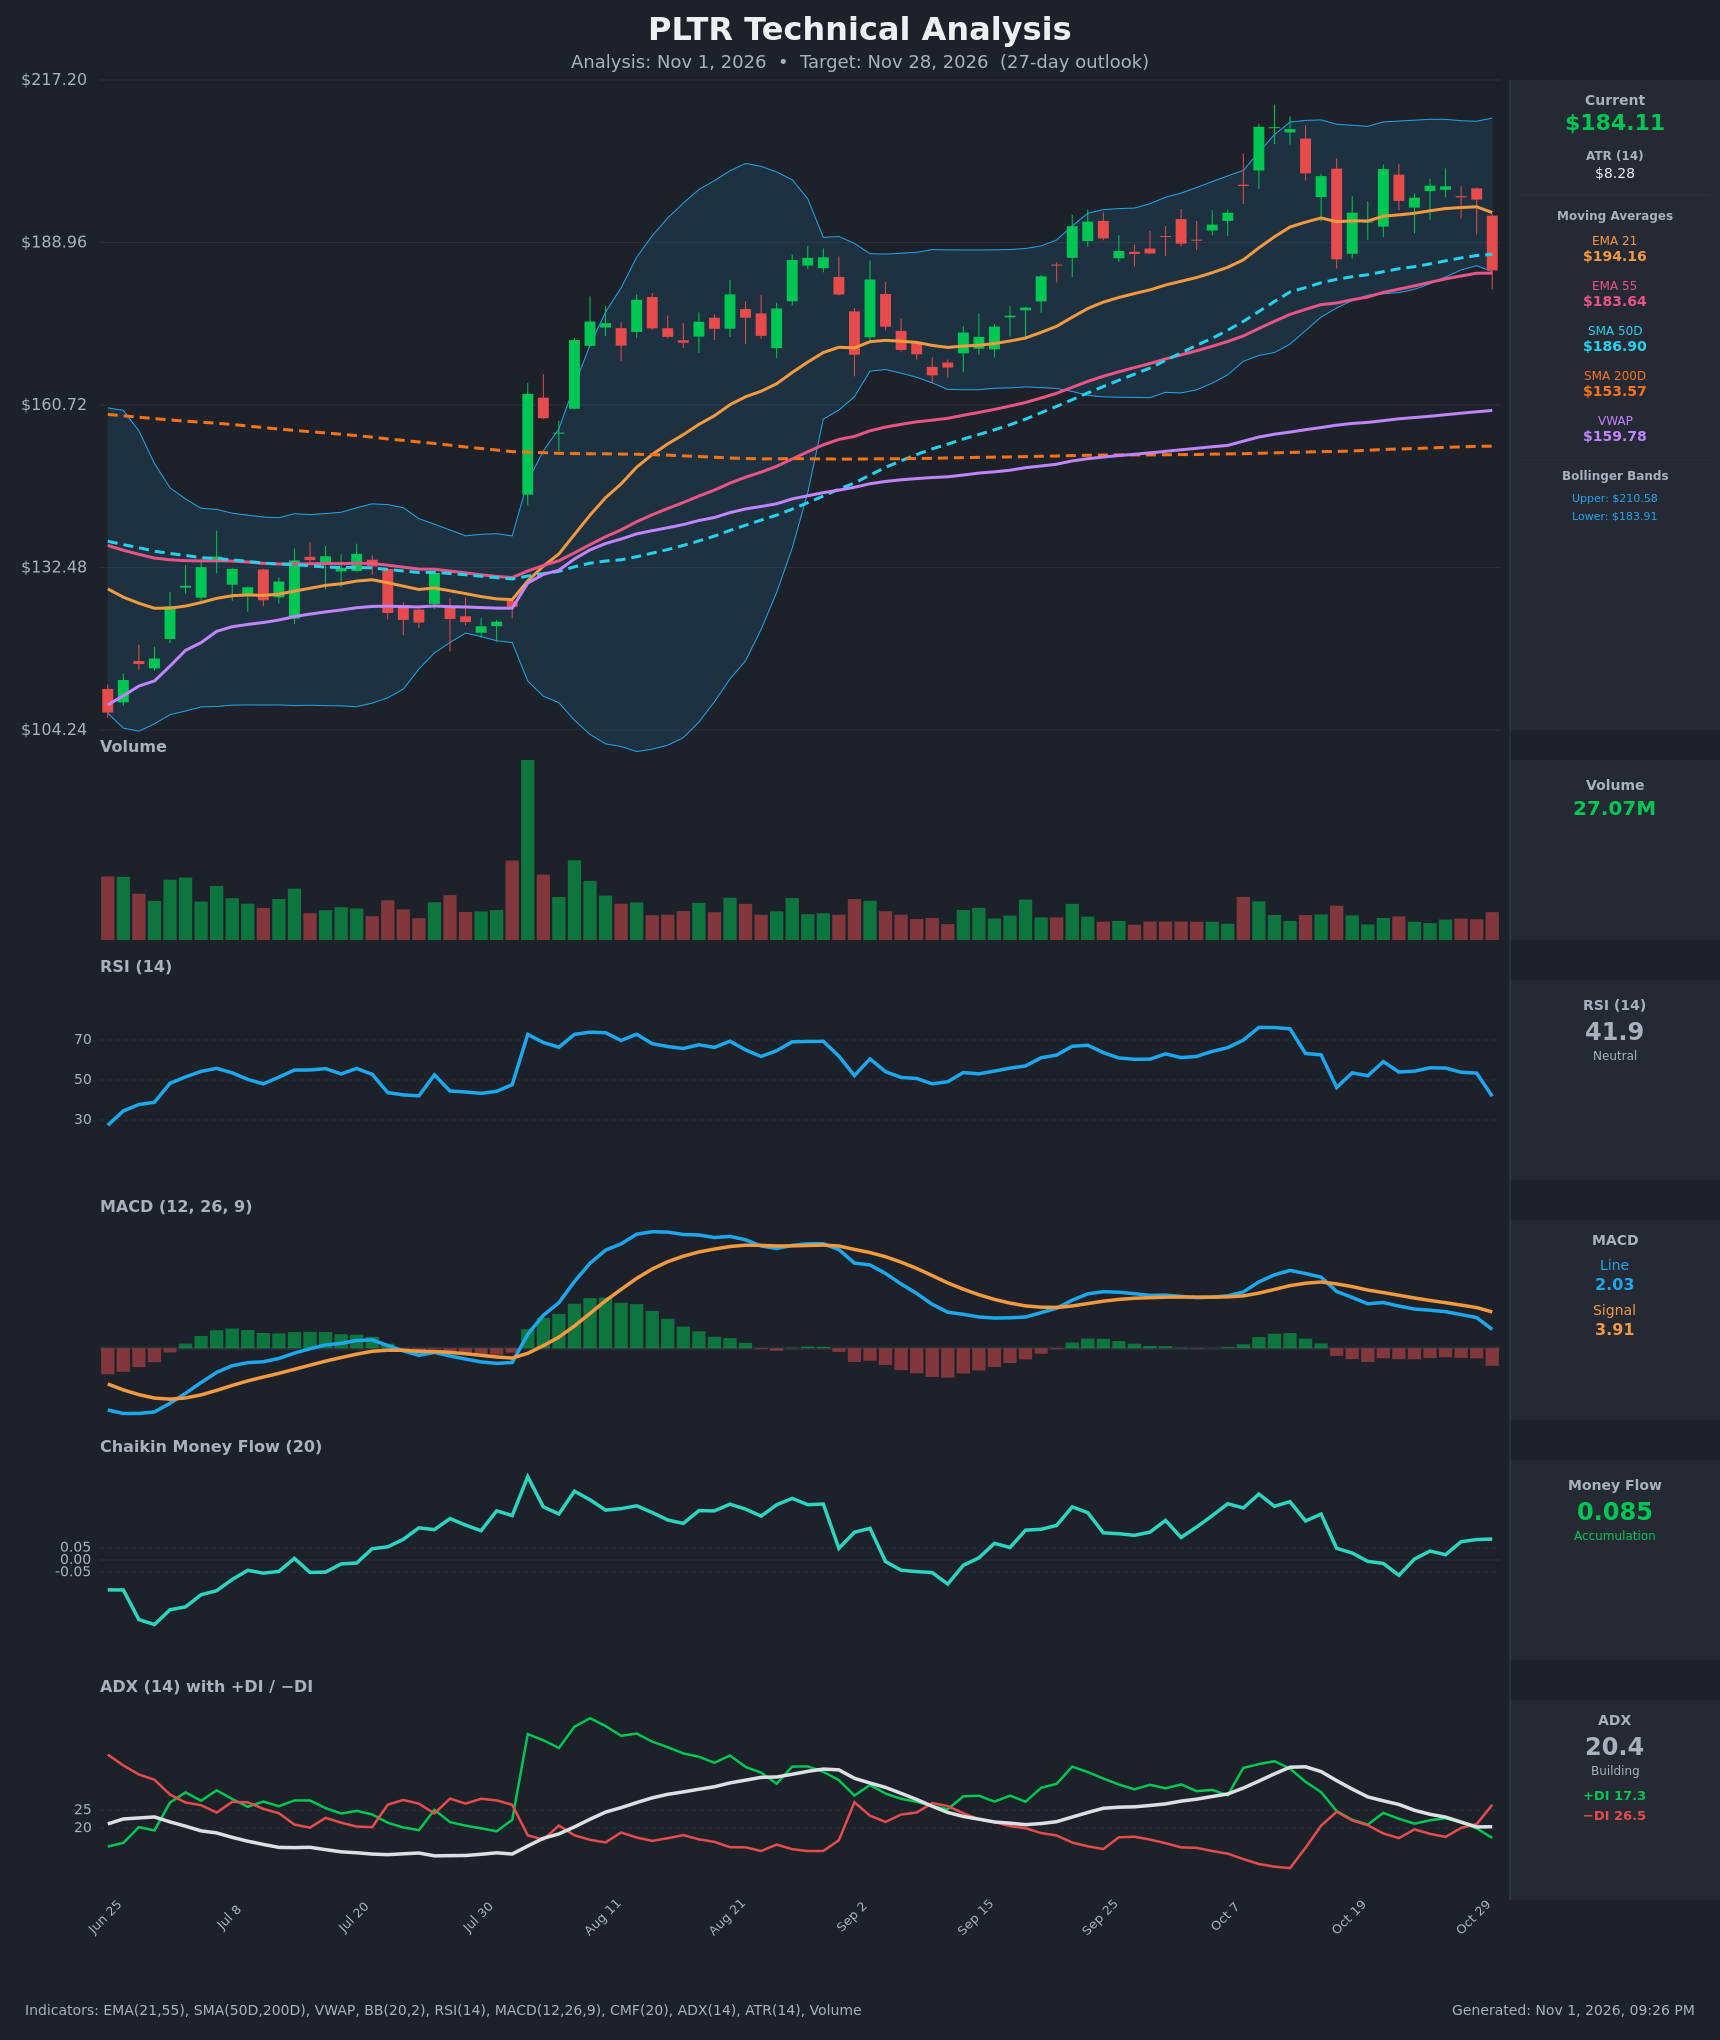
Analysis
TECHNICAL INDICATORS
- RSI (14): 41.86, down sharply from 53.4 the day before and from 76 on Oct 12. It is below the 50 midline and falling, but not yet oversold (<30). That leaves room for more downside before a momentum washout. [Bearish]
- 20 EMA (EMA 21 = $194.16): Price at $184.11 is about 5% below the EMA21, which has started to roll over (195.16 to 194.16). It now acts as overhead resistance. EMA21 is still above EMA55 ($183.64), so there is no bearish EMA cross yet, but the gap is closing fast. [Bearish]
- MACD: Line 2.03 is below the signal at 3.91, so the bearish crossover occurred around Oct 16-19. The histogram is negative (about -1.9) and widening, and the line is heading toward zero. Momentum is decaying. [Bearish]
- Bollinger Bands (20): Price ($184.11) is pinned to the lower band ($183.91). The upper band is $210.58, so the bands are wide. The Oct 30 candle was a roughly -6.3% bar that closed at the lower band. This is either a short-term oversold bounce setup or the start of a band walk lower. [Neutral]
- CMF (20): +0.085, in accumulation territory but flat to slightly rising. It has not yet reflected the Oct 30 selloff, so it is a lagging positive and the one real bullish offset. [Accumulation]
- ADX (14): 20.4 with −DI (26.5) above +DI (17.3). −DI crossed above +DI on Oct 30. ADX has fallen from 37 and is right at the 20 threshold, so the trend is weak. Bears have just taken control, but trend strength is not confirmed. [Weak Trend, bearish lean]
- Volume: 27.07M on the Oct 30 drop, higher than the muted volume of recent sessions. A heavy red candle on above-average volume points to real distribution or a news reaction, not just drift. [Bearish]
Other levels:
- SMA 50D ($186.90): Price has lost it, so it is now resistance.
- SMA 200D ($153.57): Price is well above it, so the long-term uptrend is intact.
- VWAP ($159.78): Price is well above it, which keeps the bigger picture constructive.
DIVERGENCES & TRENDS
- Price vs. momentum: Price made a high near $209 on Oct 12-13 (RSI 76). Later rebounds topped at about $201.72 and $198.84 with RSI around 56-59, and MACD kept making lower highs. This is a bearish lower-high structure, with MACD fading from 8.4 to 2.0.
- Crossovers and breaks:
- MACD bearish cross (mid-Oct).
- −DI crossed above +DI on Oct 30.
- Price lost the EMA21 and SMA50D, and sits right on EMA55 and the lower Bollinger Band.
- No golden or death cross: SMA50D is far above SMA200D.
- ADX trend: ADX has decayed from 37 to 20, showing the October rally is exhausted. A bearish DI cross with ADX at the floor often precedes either a fresh bearish trend leg or more chop.
- CMF vs. price: CMF is still positive (0.085) while price breaks down. This is a mild bullish divergence, but CMF is lagging and was near zero or negative for most of the last two weeks.
- Support cluster: EMA55 ($183.64) and the lower band ($183.91) coincide at current price. The close is sitting on the last support before the early-September range of roughly $168-175.
CHART PATTERNS
- Bearish Head and Shoulders / Double Top (loose): The $209 spike (Oct 12-13) was followed by lower highs near $201.7 and $198.8. The $183-186 zone is the neckline-like support. A decisive close below it projects toward $165-170, measured from the roughly $25 pattern height.
- Bearish Pennant / Flag (loose): The tight range of $192-202 from Oct 16 to Oct 29 after the sharp drop is a small consolidation that has now broken down. The Oct 30 break suggests continuation lower.
- Counter-view: The wider June-October structure is a higher-low uptrend, and price is still well above the rising EMA55 and SMA200D. A hold at $183 would keep that uptrend and a bounce toward $194-200 in play.
- Net read: The bearish breakdown evidence slightly outweighs the bullish structure.
POTENTIAL SCENARIOS
- Scenario 1: Bearish Breakdown Through the EMA55/Lower-Band Support — The Oct 30 selloff continues. Price loses the $183.6 support cluster, MACD and −DI stay in control, and sellers push into the September range. Trigger: daily close below $183.60 (confirmation below $180). Target: $172-177 first, then $165-170 if momentum accelerates. Invalidation: daily close back above $194 (EMA21). (50% probability)
- Scenario 2: Bullish Oversold Bounce at Support — Price holds the EMA55 and lower band, CMF accumulation persists, and a rebound retests the broken averages. Trigger: strong green close above $187 (SMA50D) on rising volume. Target: $194-198 (EMA21 and recent highs), with an extension to $205 only on a break above $200. Invalidation: close below $180. (33% probability)
- Scenario 3: Neutral Range Consolidation — Price chops between roughly $175 and $194 as ADX stays below 20 and no side takes control. Trigger: failure to close beyond either $183 or $194 for several sessions. Target: $180-190. Invalidation: a close outside $172-196. (17% probability)
PRICE TARGETS
- Target Price: $177.50 (27-day horizon, nearly 4% below current)
- Expected Range: $164.00 to $191.00 (width $27.00, about 14.7% of current price, consistent with the 12-18% guidance for a 30-60 day-class horizon scaled to 27 days)
- Key Levels: Support at $170.00 (early-September consolidation low, below the immediate $183.64 EMA55 floor), Resistance at $186.90 (SMA50D, with $194.16 EMA21 above it)
OVERALL BIAS
OVERALL BIAS: BEARISH - Price broke down on higher volume to the lower Bollinger Band and the EMA55. MACD is bearish and widening, −DI has crossed above +DI, and price has lost the EMA21 and SMA50D after a series of lower highs. The long-term uptrend (above SMA200D) and positive CMF limit the downside, so conviction is moderate.
This is educational analysis and not financial advice.