RKLB 27-day bearish forecast — Nov 1, 2026
- Bias: Bearish
- Timeframe: 27 days (made Nov 1, 2026, target date Nov 27, 2026)
- Price at analysis: $54.73
- Price target: $51.50
- Expected range: $46.00 – $58.00
- Result: Pending — graded after the close on Nov 27, 2026
Get a free AI analysis of RKLB today
Analysis
TECHNICAL INDICATORS
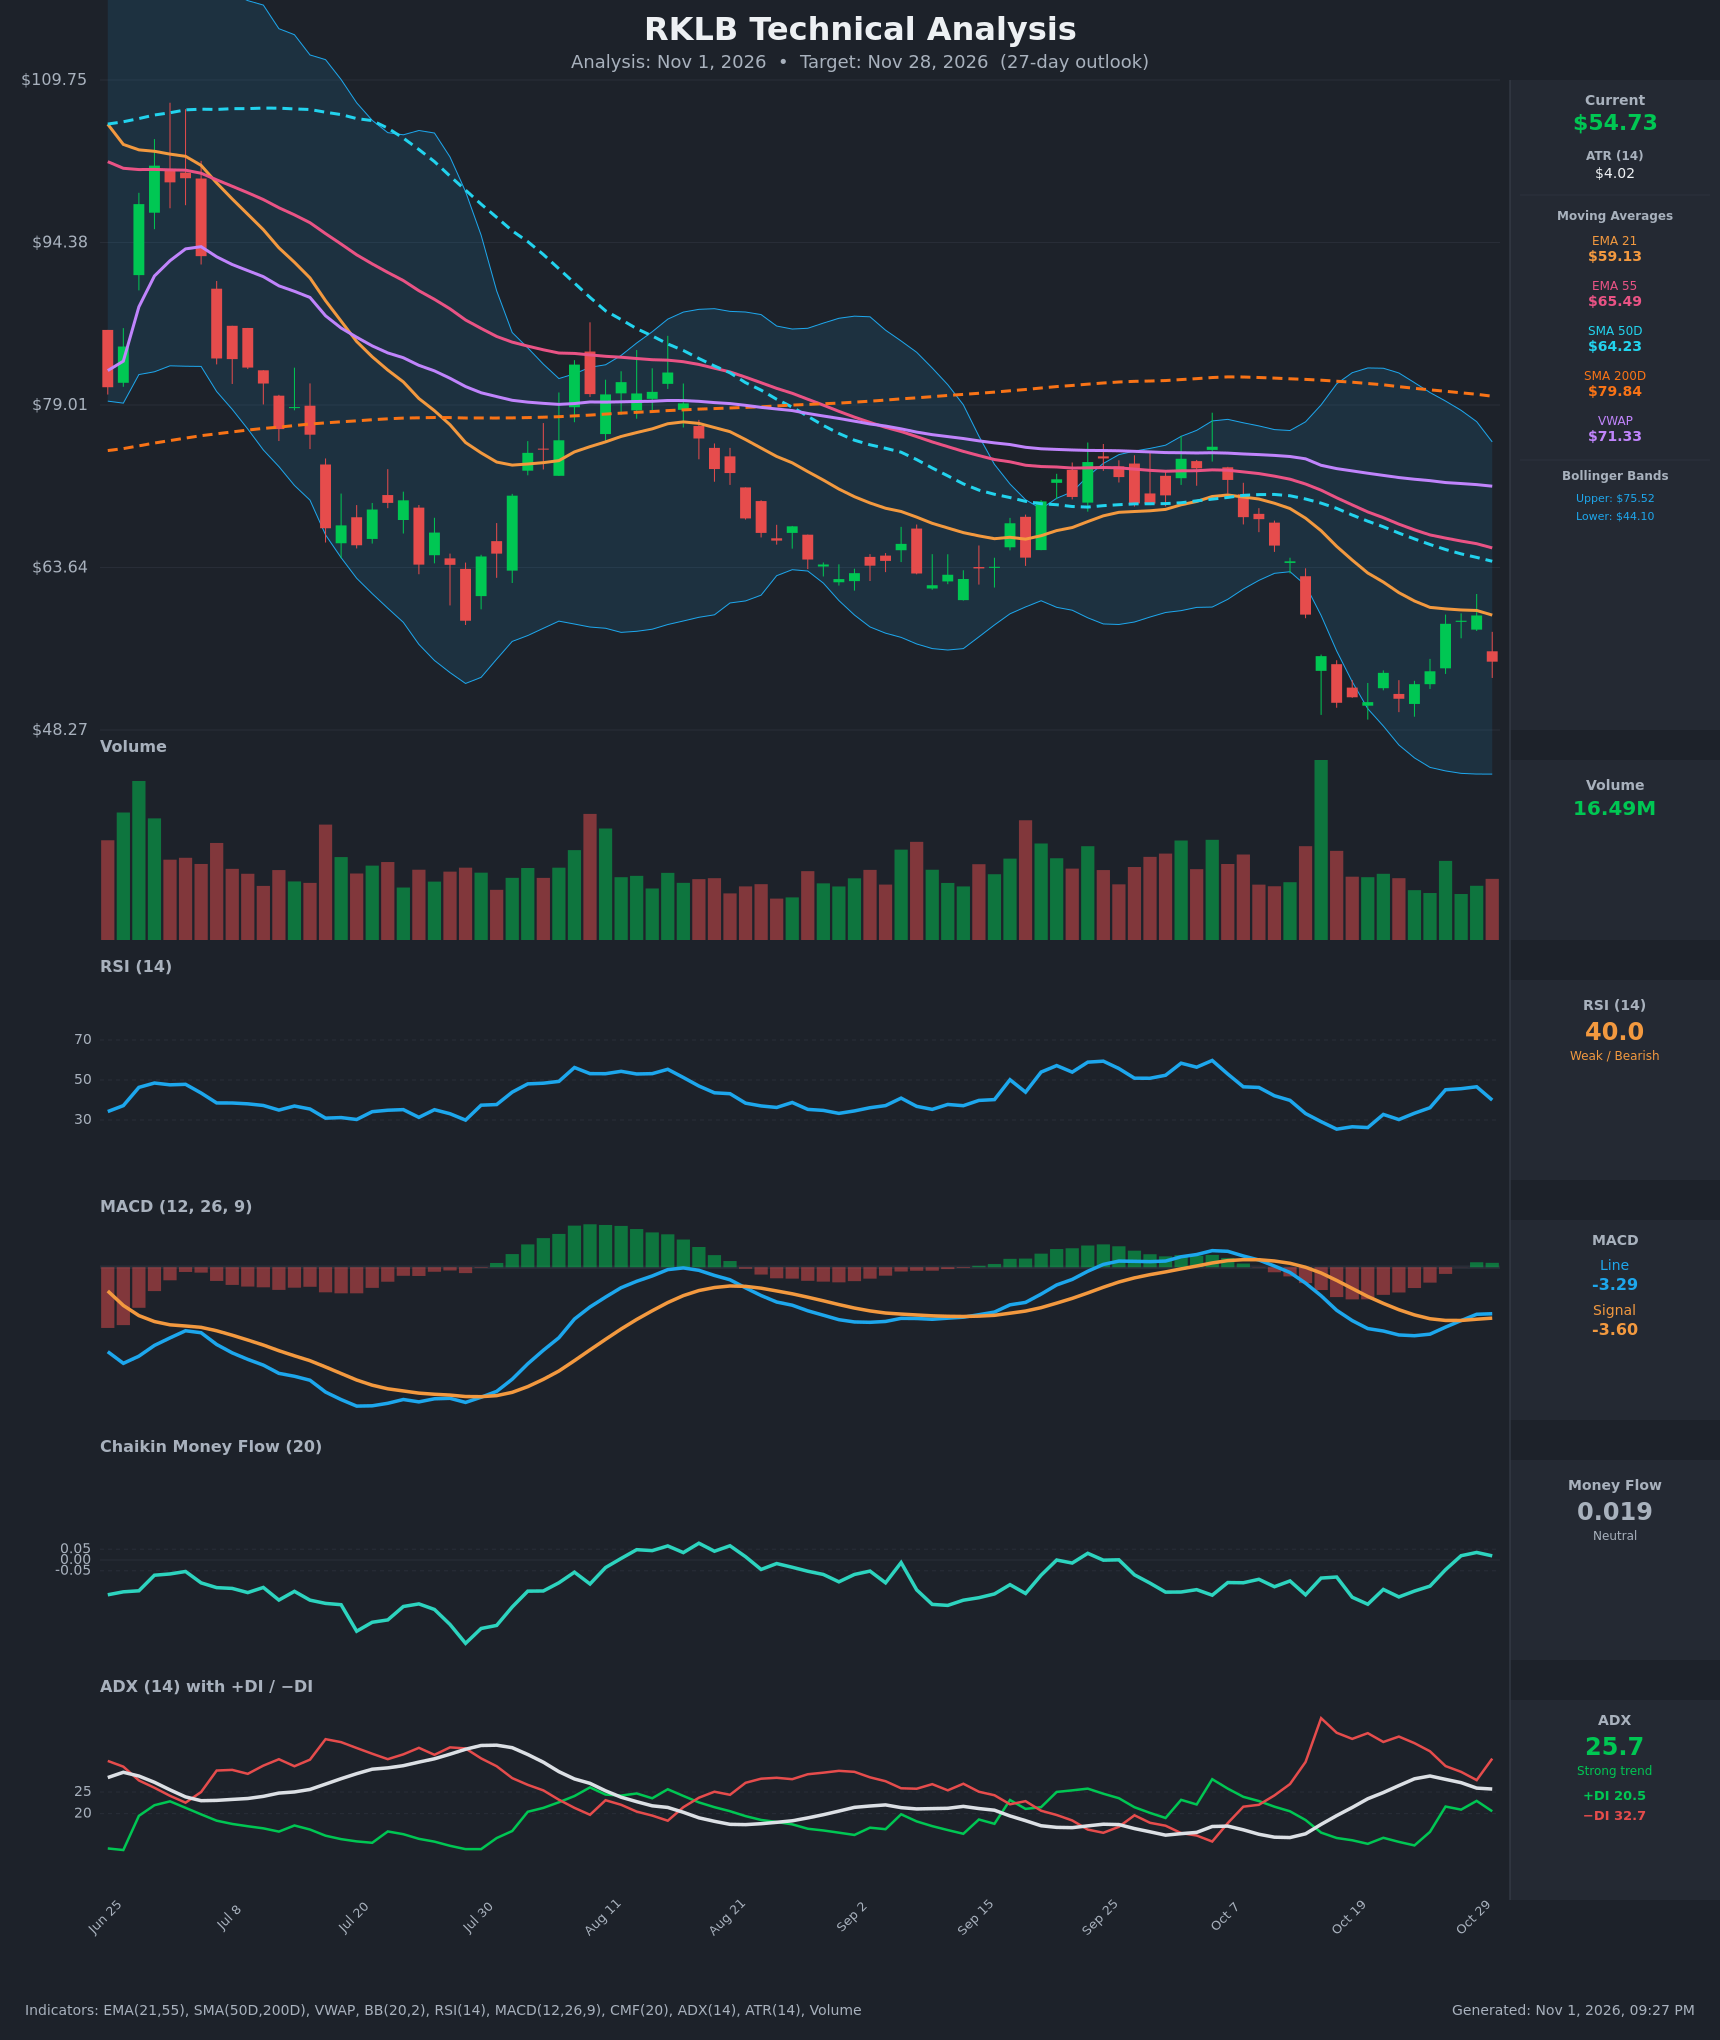
- RSI (14): 39.96, bounced from deeply oversold (25.4 on Oct 16) to 46.6 on Oct 29, then fell back to 40 after the latest red candle. It is below 50, and the bounce failed under the midline. [Bearish]
- 20 EMA: The 21 EMA is $59.13, with price at $54.73 below it. The EMA is falling steeply and sits above price, so it acts as resistance. The 21 EMA is also below the 55 EMA ($65.49), and the gap is widening. [Bearish]
- MACD: Line -3.29 versus signal -3.60, so the line is just above the signal (a marginal bullish crossover on Oct 28 to 29). Both lines are deeply negative and the histogram is barely positive. The relief bounce is fading and the line is flattening while price rolls over. [Neutral]
- Bollinger Bands (20): Upper $75.52, lower $44.09, so the bands are wide after the selloff. Price at $54.73 is in the lower half, below the midline (~$59.8). It bounced off the lower band area (~$50) and was rejected near the midline. [Bearish]
- CMF (20): 0.019, between -0.05 and +0.05. It improved from -0.20 to slightly positive, which shows selling pressure easing but no real accumulation. [Neutral]
- ADX (14): 25.7 with −DI 32.7 above +DI 20.5. This is a strong trend with bears in control. ADX is slightly off its 28.7 peak but still above 25, and −DI is re-expanding after the latest drop. [Strong Trend – Bearish]
- Volume: 16.49M, roughly average. The capitulation spike (Oct 14–16) was the highest volume in the period, and the bounce came on lighter volume. The latest red bar has modest volume, so there is no sign of a confirmed reversal. [Bearish-leaning / no accumulation confirmed]
DIVERGENCES & TRENDS
- Price made a lower low around Oct 16 to 22 ($50.84 to $51.22) while RSI made a higher low (25.4 to 30.2). This is a mild bullish divergence, and it helped fuel the bounce to about $59.
- The bounce failed at the 21 EMA ($59.1) and the RSI midline. Price then dropped about 7% on Oct 30 to $54.73, so the divergence has not yet produced a trend change.
- Moving averages are stacked bearishly: price < EMA21 < EMA55 < SMA50D < VWAP < SMA200D. SMA50D ($64.23) is falling toward SMA200D ($79.84), and the gap is wide, so a death cross is not imminent but the structure is bearish. Price is well below SMA200D, a long-term downtrend.
- MACD had a bullish crossover on Oct 28, but it is weak and sits deep below zero.
- DI: −DI has stayed above +DI since Oct 12 and re-widened (27.8 to 32.7) on the last bar.
- The CMF turned slightly positive, so there is no heavy distribution.
CHART PATTERNS
- The broad structure since June is a series of lower highs and lower lows, a persistent downtrend following the sharp early-June peak.
- The Oct 14–22 flush with a rebound to $59 and rejection resembles a Bearish Flag/Pennant continuation (reference diagram: Bearish Flag Pattern). The measured move projects toward the prior low and below, roughly $44–$50.
- The earlier bullish double-bottom-like lows at $50.8 and $51.2 form a support zone. A break below ~$50.8 would confirm the bearish continuation and open the lower Bollinger Band (~$44).
- A bullish reversal would require a reclaim of the $59–$60 area (EMA21 and the Oct 29 high). That would turn this into a double bottom with a neckline near $59–$60.
POTENTIAL SCENARIOS
- Scenario 1: Bearish Continuation Flag Breakdown — The failed bounce at the 21 EMA and −DI dominance suggest a retest and break of the $50.8 lows. Trigger: daily close below $50.80 on rising volume. Target: $46–$48, with an extension toward the lower Bollinger Band at ~$44. Invalidation: daily close above $59.50 (EMA21). (50% probability)
- Scenario 2: Neutral Base/Range — Price holds the $50–$59 range as selling exhausts (RSI divergence, CMF slightly positive). Trigger: repeated holds above $50.8 with contracting volume. Target: $52–$58 range. Invalidation: close below $50 or above $60. (22% probability)
- Scenario 3: Bullish Double Bottom Reversal — Price reclaims the EMA21 and neckline with a MACD and RSI push above 50. Trigger: close above $60 on strong volume. Target: $64–$66 (EMA55/SMA50D). Invalidation: close below $50.80. (28% probability)
PRICE TARGETS
For the 27-day horizon (about 12–18% range width guidance):
- Target Price: $51.50
- Expected Range: $44.50 to $60.50 (width $16.00, about 29% of price). Per the guidance, 30–60 days calls for roughly 12–18%, so a tighter range is more appropriate: $46.00 to $58.00 (width $12.00, about 21.9%). This is still slightly above the guide but reflects the high volatility (ATR of $4.02, about 7.4% of price).
- Key Levels: Support at $50.80, Resistance at $59.13
Final committed values: Target $51.50, Expected Range $46.00 to $58.00, Support $50.80, Resistance $59.13.
OVERALL BIAS
OVERALL BIAS: BEARISH - Price is below every major moving average with −DI dominant (32.7 vs 20.5) and ADX above 25. The bounce failed at the 21 EMA and RSI is rolling over below 50, so a retest of the $50.80 lows and possible break is more likely than a reversal. The mild RSI divergence keeps downside moderate.
This is educational analysis and not financial advice.