SMH 27-day bearish forecast — Nov 1, 2026
- Bias: Bearish
- Timeframe: 27 days (made Nov 1, 2026, target date Nov 27, 2026)
- Price at analysis: $522.49
- Price target: $497.00
- Expected range: $455.00 – $545.00
- Result: Pending — graded after the close on Nov 27, 2026
Get a free AI analysis of SMH today
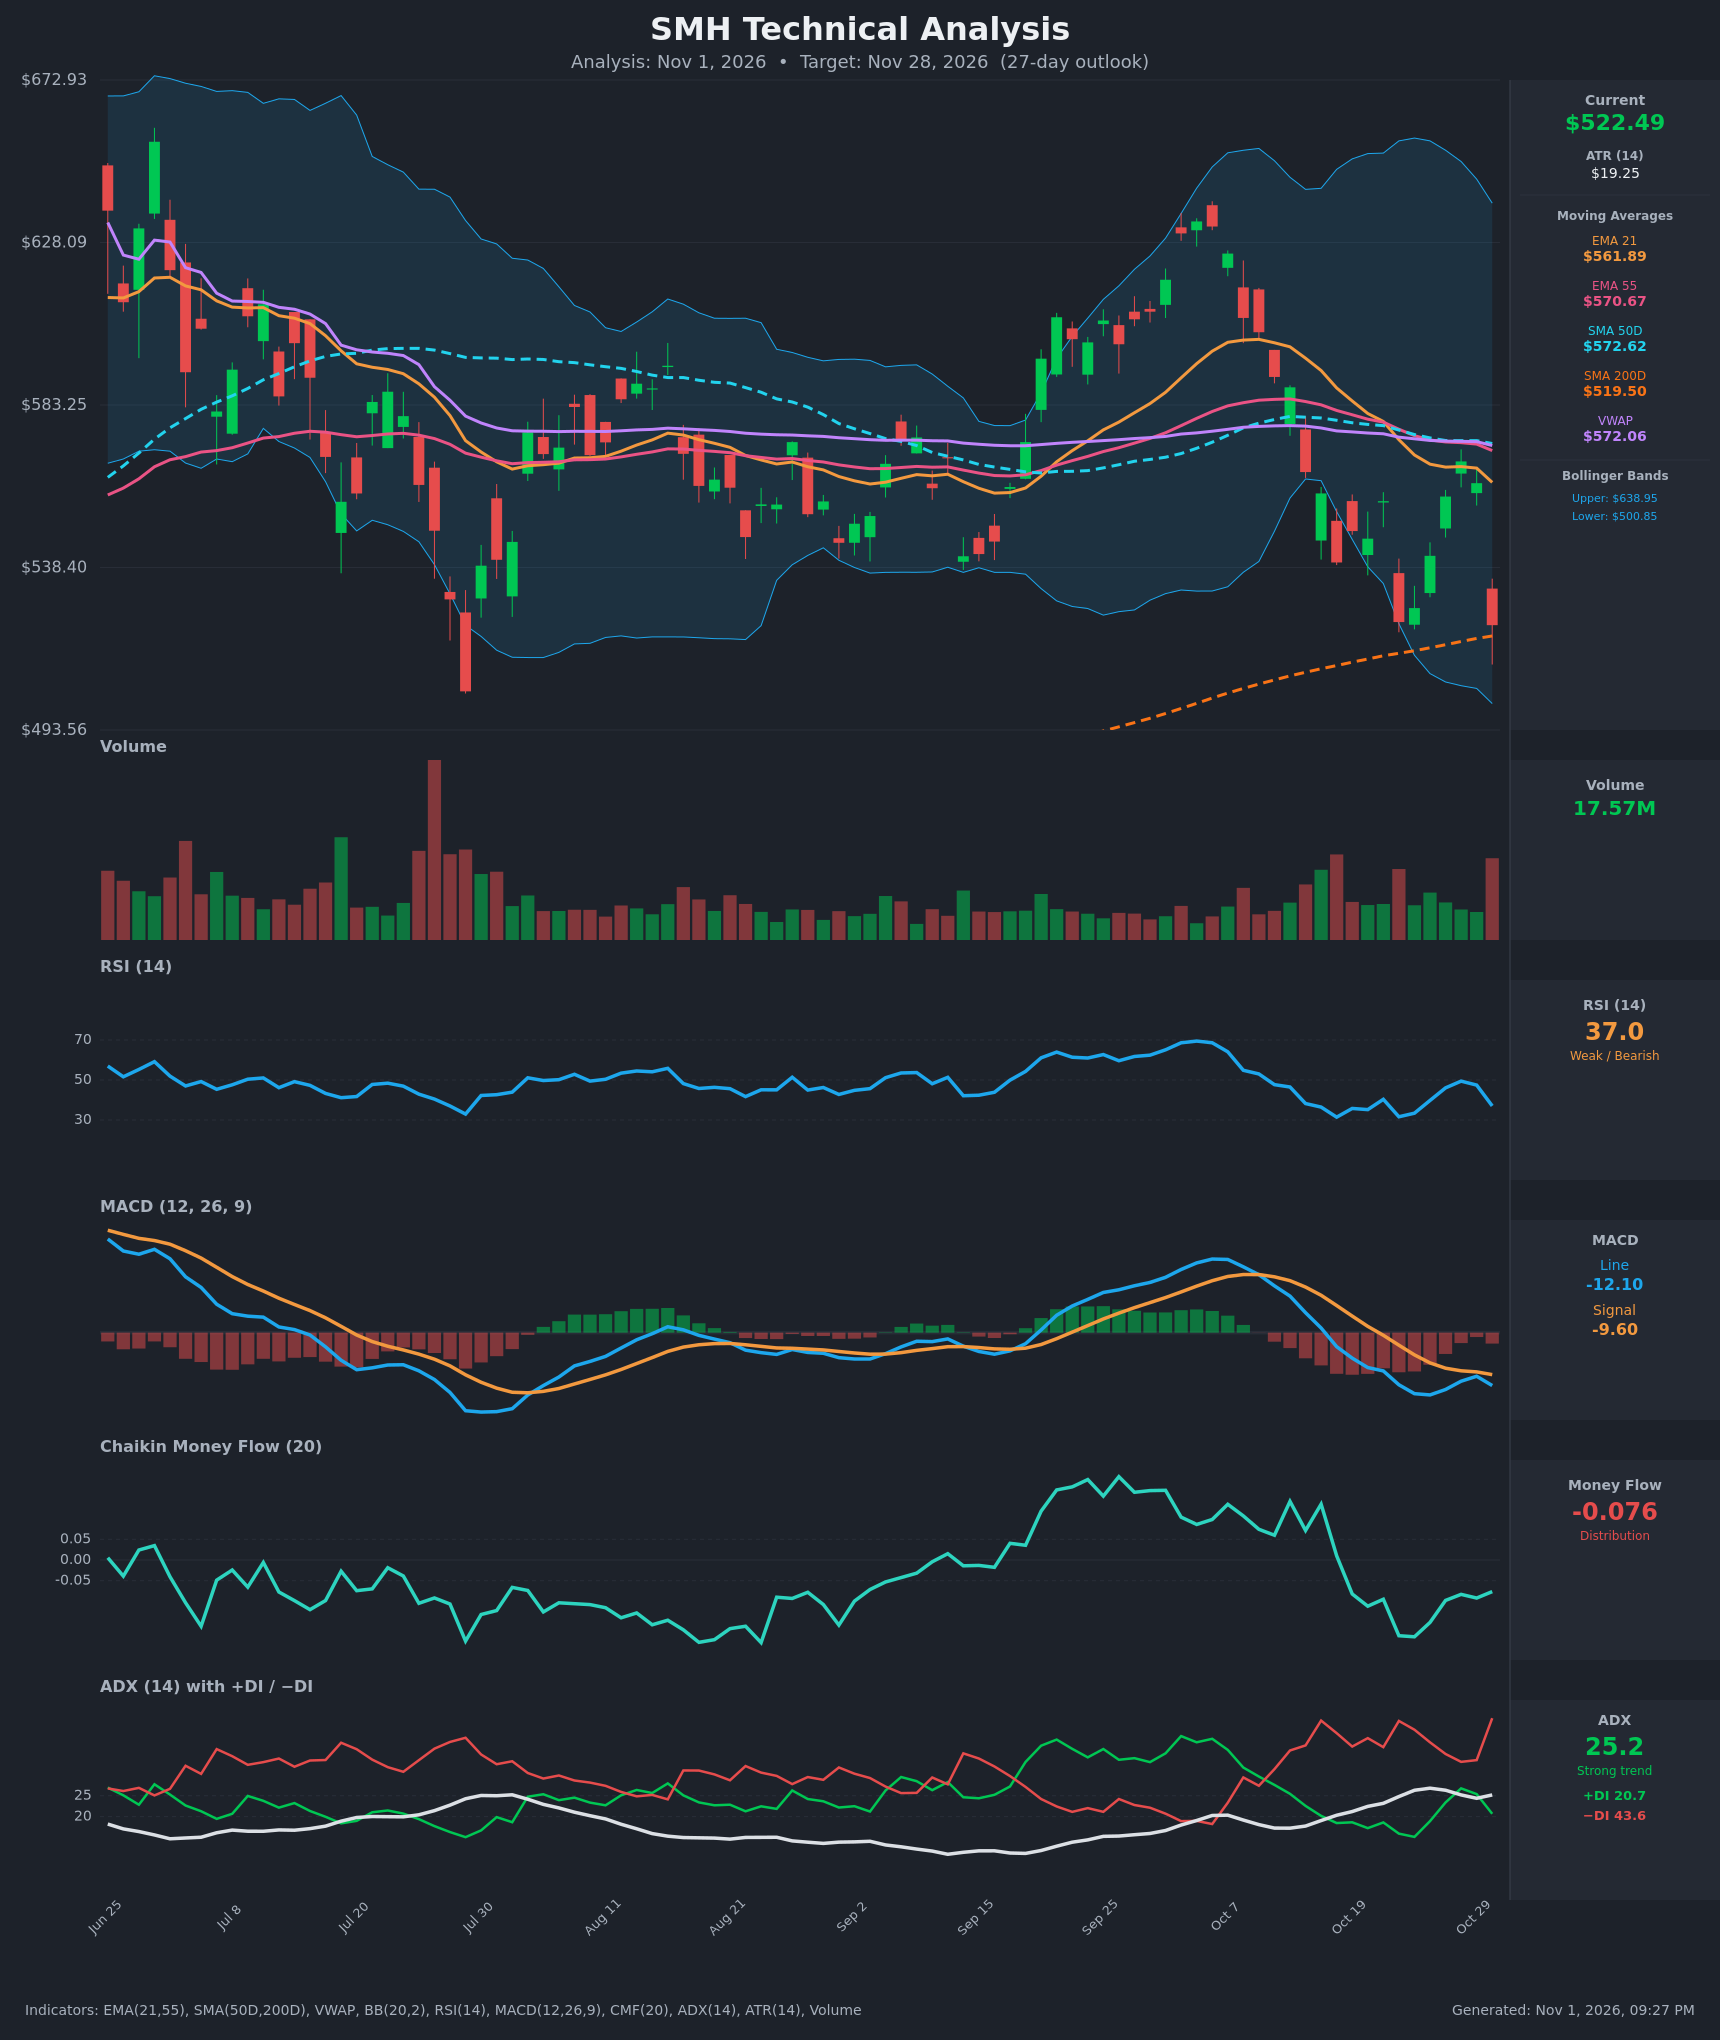
Analysis
TECHNICAL INDICATORS
- RSI (14): 37.04, down sharply from 47.5 the prior day and below the 50 midline. It is weak but not oversold (<30). The Oct 16 and Oct 22 lows saw 31-32 readings, so there is room for another leg down before a true oversold signal. [Bearish]
- 20 EMA: The 21 EMA is at $561.89, and price at $522.49 is about 7% below it. The EMA21 crossed below the EMA55 ($570.67) around Oct 22 and now sits below the SMA50D as well. The EMA21 is overhead resistance. [Bearish]
- MACD: Line -12.10 is below signal -9.60, with a negative histogram of about -2.5. The bearish crossover occurred around Oct 21 and both lines are below zero. The line was starting to curl up toward the signal on Oct 28-29 but rolled over again on the Oct 30 drop. [Bearish]
- Bollinger Bands (20): Upper $638.95, lower $500.85, so the bands are wide and price sits near the bottom of the range (%B about 0.16). Price is in the lower band zone but has not closed outside it. Outright riding of the lower band would signal continuation, while a hold above $500 could allow a mean-reversion bounce. [Bearish]
- CMF (20): -0.076 is below the -0.05 threshold. It has been negative since about Oct 19 after collapsing from strongly positive readings in September, which points to sustained distribution. [Distribution]
- ADX (14): 25.2 and rising from 17 on Oct 12, so a trend is now established. −DI at 43.6 is far above +DI at 20.7, a wide 23-point spread that shows sellers firmly in control. [Strong Trend + Bearish]
- Volume: 17.57M on Oct 30 is the largest bar in recent weeks on a roughly 7% down candle, a classic high-volume distribution/breakdown day. The recent bounce (Oct 26-28) came on average volume. [Bearish – selling conviction]
DIVERGENCES & TRENDS
- No clear bullish RSI divergence. RSI made a higher low on Oct 22 (31.6) versus Oct 16 (31.4), roughly equal, while price made a lower low ($523 vs $540). That is a minor divergence. The Oct 30 reading of 37 is not showing an oversold turn.
- MACD is below zero and below signal, consistent with price. The histogram had been narrowing but is re-expanding negatively.
- EMA21 crossed below EMA55 (about Oct 22), a bearish crossover. EMA21 is also now below SMA50D.
- Price is below EMA21, EMA55, SMA50D and VWAP ($572.06), which confirms a short-term downtrend. It is only about 0.6% above the SMA200D at $519.50, the last major trend support. SMA50D ($572.62) remains above SMA200D, so there is no death cross yet, but the gap is narrowing.
- The DI spread (−DI 43.6 vs +DI 20.7) and rising ADX confirm bearish trend strength. The failed bounce to $567.67 on Oct 28 made a lower high.
- CMF has flipped from strong accumulation (September) to distribution, a clear deterioration in money flow.
CHART PATTERNS
- Bearish Double Top (reversal): Highs near $640-650 in June and again in early October, with a neckline/support zone around $500-505 (the late-July low). Price is now approaching that neckline. A decisive close below about $500 would confirm the pattern. The full measured move (about $140) points toward the mid-$300s, which is unrealistic for 27 days, so a partial move to the $450-480 area is more plausible.
- Failed bounce / bearish flag-like structure: The Oct 22-28 rebound to $567.67 was rejected at the declining EMAs and SMA50D cluster ($565-573) and quickly reversed. This resembles a Bearish Flag/Pennant continuation after the sharp drop from the October high.
- Key confluence: SMA200D ($519.50), the Bollinger lower band ($500.85) and the July low ($505) form a stacked support zone. A hold there could produce a range-bound bounce, but a break would accelerate selling.
POTENTIAL SCENARIOS
- Scenario 1: Bearish Support Breakdown — Sellers keep control (−DI dominant, CMF negative, high-volume breakdown candle). Price loses the SMA200D and breaks the double-top neckline near $500. Trigger: daily close below $500.85 / $500 on elevated volume. Target: $470-$485, with an extension toward $455. Invalidation: a daily close back above $561.89 (EMA21). (50% probability)
- Scenario 2: Neutral Support Hold and Range — The SMA200D/lower Bollinger band zone holds and price chops between $500 and $555 as RSI resets. Trigger: lows holding $500-$505 with a bullish RSI/MACD turn. Target: $525-$550. Invalidation: close below $500 or above $565. (28% probability)
- Scenario 3: Bullish Oversold Rebound — A sharp mean-reversion bounce off the SMA200D reclaims the EMA cluster. Trigger: close above $545, then above $562 on rising volume and CMF turning positive. Target: $570-$590 (EMA55/SMA50D/VWAP cluster). Invalidation: failure at $562 or close below $500. (22% probability)
PRICE TARGETS
- Target Price: $497.00 (27-day)
- Expected Range: $455.00 to $545.00 (width $90 = about 17.2% of current price, consistent with the 30-60 day guidance, scaled for 27 days)
- Key Levels: Support at $500.85 (lower Bollinger Band, with SMA200D at $519.50 just above and the July low near $505), Resistance at $561.89 (EMA21, with the EMA55/SMA50D/VWAP cluster at $570-573 above)
OVERALL BIAS
OVERALL BIAS: BEARISH - Price is below all key short-term moving averages after a high-volume breakdown, with −DI (43.6) far above +DI (20.7), ADX rising through 25, a negative MACD, and CMF in distribution. The nearby SMA200D/lower-band support could slow the decline, so conviction is moderate, but the evidence favors a test and likely break of about $500.
This is educational analysis and not financial advice.