SOFI 27-day bullish forecast — Nov 1, 2026
- Bias: Bullish
- Timeframe: 27 days (made Nov 1, 2026, target date Nov 27, 2026)
- Price at analysis: $16.76
- Price target: $17.45
- Expected range: $15.60 – $18.40
- Result: Pending — graded after the close on Nov 27, 2026
Get a free AI analysis of SOFI today
Analysis
TECHNICAL INDICATORS
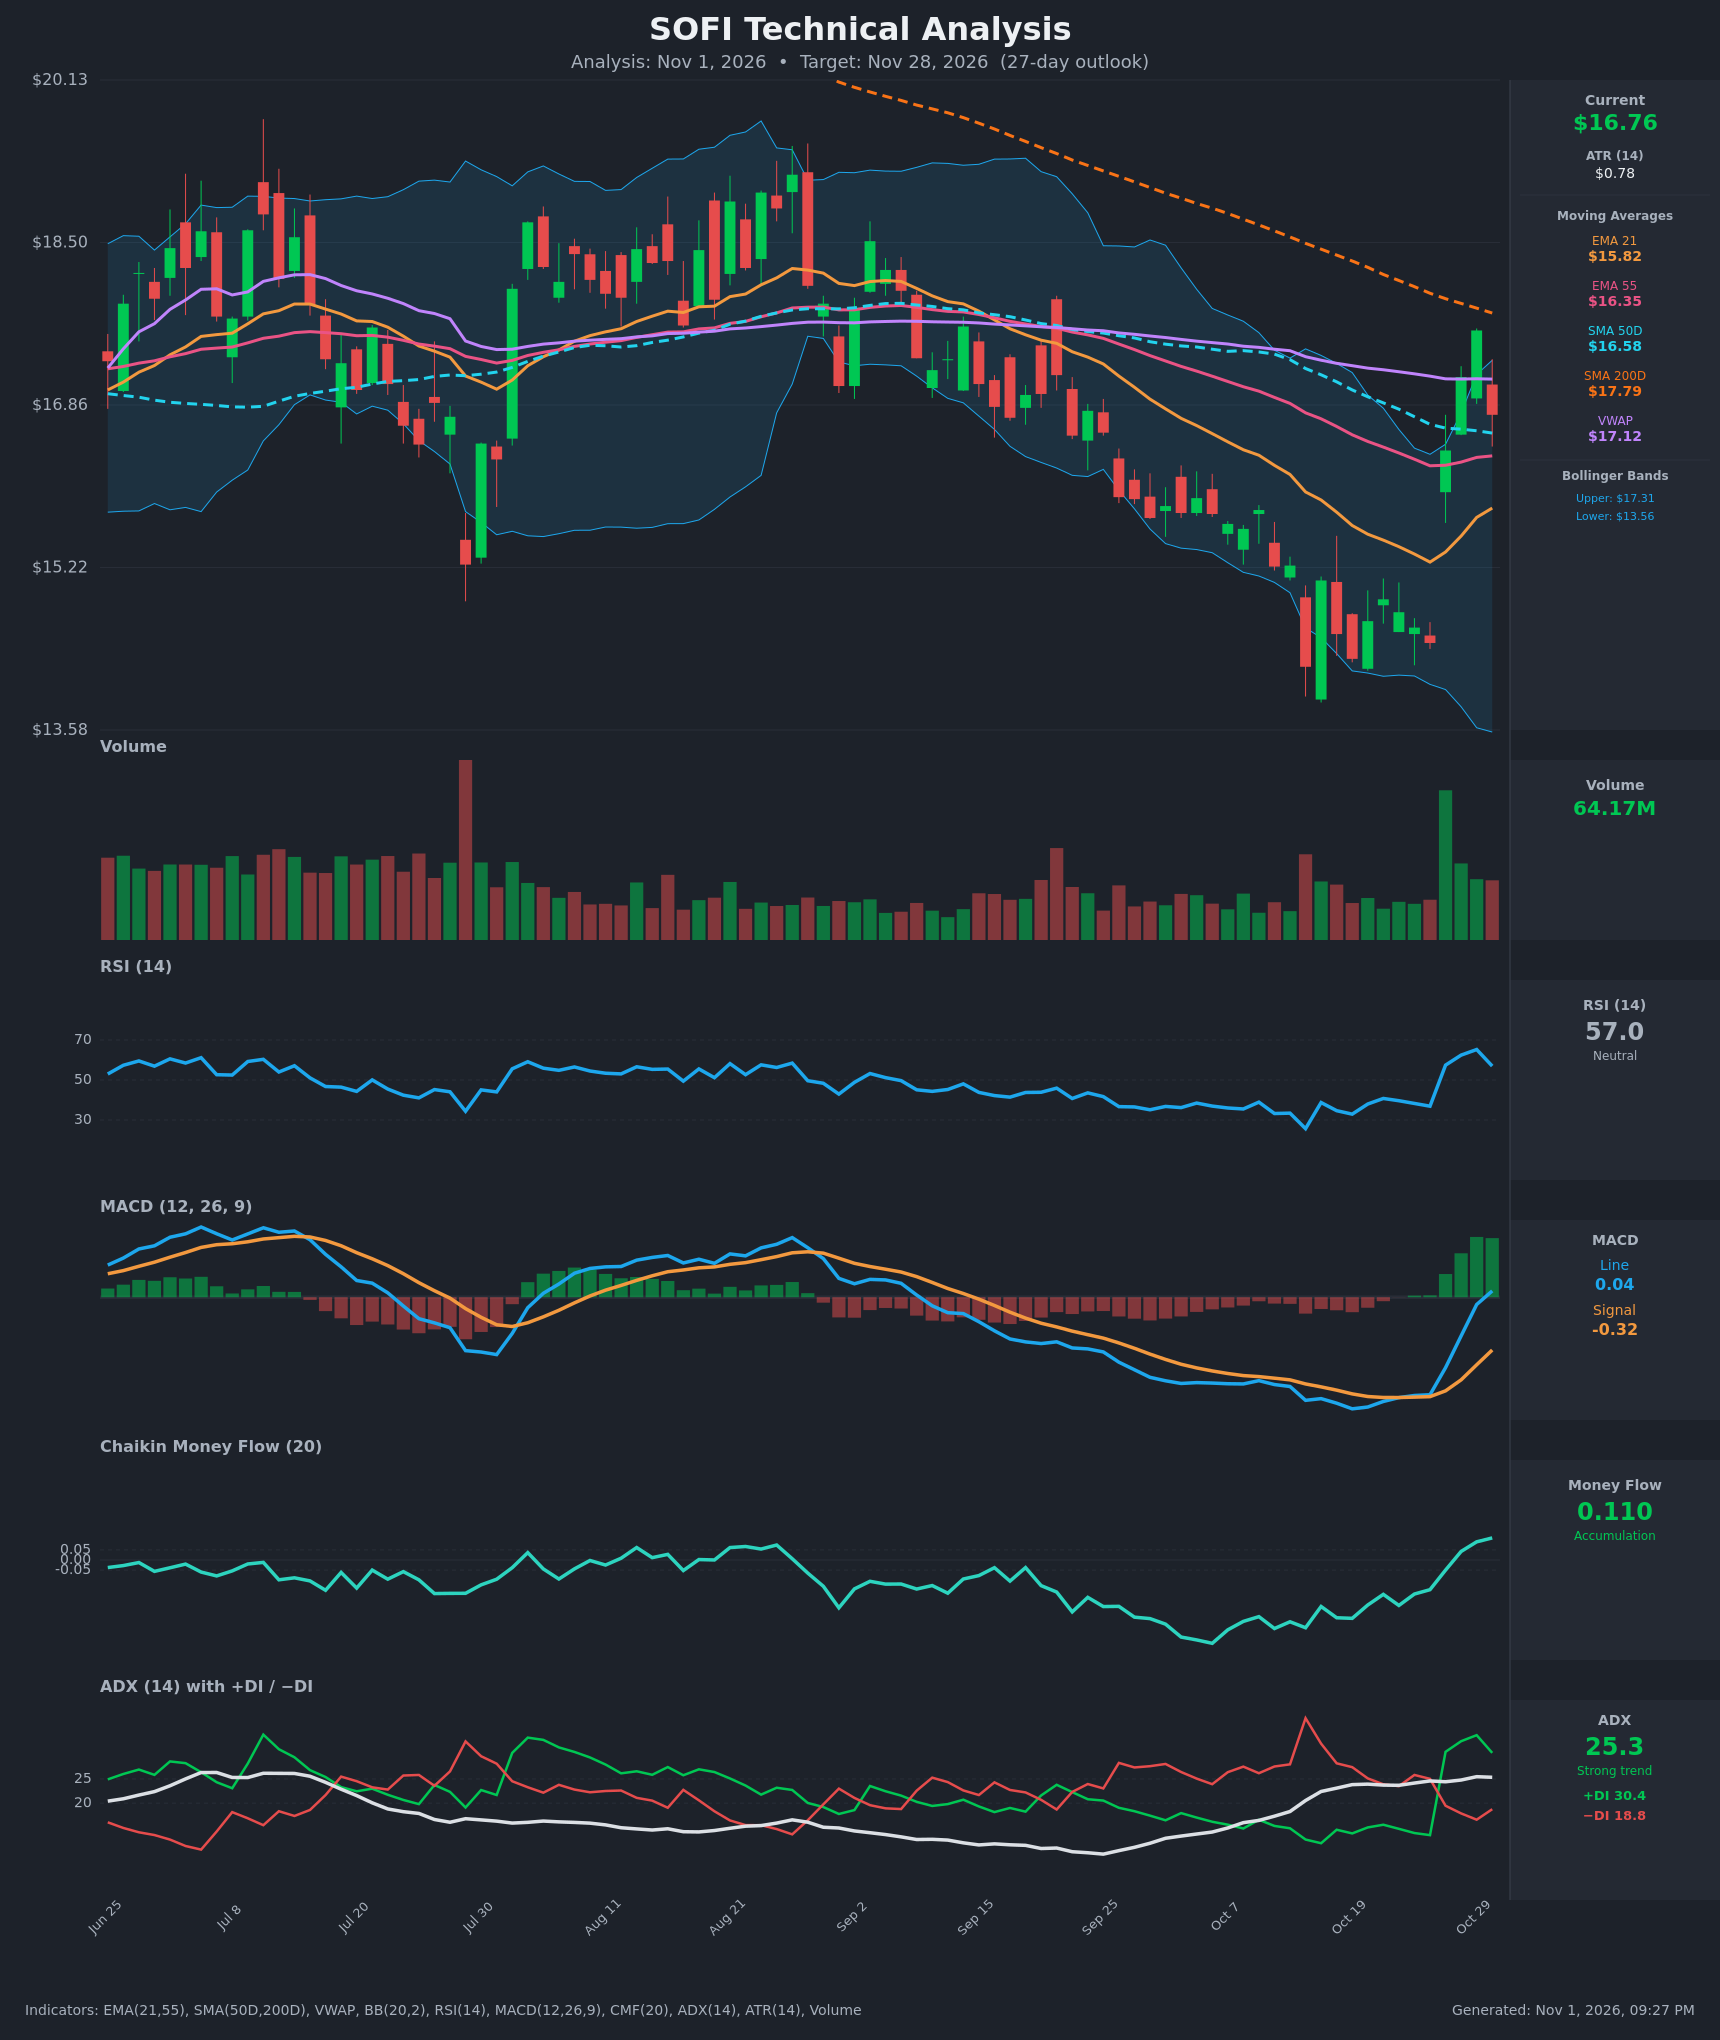
- RSI (14): 56.97, down from 65.2 on Oct 29 after a surge from 25.7 on Oct 14. It sits above the 50 midline with room before 70, though the latest tick is a cooling-off from the near-overbought peak. [Bullish]
- 20 EMA: The supplied value is the EMA 21 at $15.82, with price at $16.76 about 6% above it. The EMA 21 has turned upward from $15.27 and is rising. It sits below the EMA 55 ($16.35), so there is no bullish EMA crossover yet. [Bullish]
- MACD: The line (0.038) crossed above the signal (-0.322) on Oct 30, and the histogram has flipped positive and is expanding. The crossover occurred below or near the zero line, which is an early, constructive signal. [Bullish]
- Bollinger Bands (20): Upper $17.31, lower $13.56, midline about $15.44. Price is in the upper half of the bands after briefly closing above the upper band at $17.61. The bands are wide, which reflects a volatility expansion from the gap. The mean-reversion risk is toward the midline, but a band walk is possible. [Neutral]
- CMF (20): 0.110, rising from -0.34 on Oct 12 and above the +0.05 threshold for three sessions. This is a clear shift from distribution to accumulation. [Accumulation]
- ADX (14): 25.3 with +DI 30.4 above −DI 18.8. The DI cross on Oct 27 flipped control to the bulls, and ADX is just crossing the 25 trend-strength threshold. It was previously driven by the downtrend, so this is a fresh trend change. [Strong Trend + Bullish]
- Volume: 64.17M. The Oct 27 gap-up bar (about $14.46 to $16.40) had the heaviest volume of the visible period, and the following sessions kept above-average volume. The Oct 30 red candle came on lighter volume than the surge, which makes it look like a pullback rather than a reversal. [Bullish – accumulation on the breakout]
DIVERGENCES & TRENDS
- Momentum shift: RSI rose from 25.7 to 65 in about two weeks, and the MACD histogram turned from persistently negative to sharply positive. The earlier lower-low price action in mid-October did not bring new MACD lows, and MACD was already flattening near -0.6. This is a mild bullish divergence that preceded the reversal.
- Moving average structure: Price has reclaimed the EMA 21 ($15.82), EMA 55 ($16.35) and SMA50D ($16.58). It remains below VWAP ($17.12) and SMA200D ($17.79). The SMA50D ($16.58) is below the SMA200D ($17.79), so the death cross is already in place and the long-term trend is still down.
- Downtrend resistance: The dashed orange line on the chart declines from the August high, and price was rejected near it ($17.61 high, then $16.76). Resistance lines up at $17.1–$17.8 (VWAP, SMA200D, trendline).
- Candle behavior: The Oct 30 candle is red, a roughly 4.8% pullback from $17.61. RSI and the MACD line both ticked lower or flattened, so short-term consolidation or a gap retest is likely before any continuation.
- Crossovers: MACD bullish cross (Oct 30), +DI over −DI (Oct 27), and CMF above +0.05. Still pending are the EMA21/EMA55 bullish cross (the gap has narrowed from about $1.19 to $0.53) and a reclaim of the SMA200D.
CHART PATTERNS
- Bullish Falling Wedge / downtrend break (reversal): From the August high, SOFI made lower highs and lower lows into the $14.2–$14.5 low, then broke out with a high-volume gap. This resembles a falling wedge or double-bottom-style reversal. The measured move points toward the prior pivot area around $17.8–$18.5, and a full retracement toward $19 would need a break of the SMA200D.
- Possible retest: The current red candle looks like a retest of the breakout area, as in a bullish flag after a sharp advance. Holding $16.0–$16.4 keeps the pattern valid.
- Caution: The failed tag of the descending trendline and the SMA200D overhead means a bearish lower-high is possible. A close below $15.80 would mean the gap was a dead-cat bounce.
POTENTIAL SCENARIOS
- Scenario 1: Bullish Breakout Continuation — Price holds the EMA 55/SMA50D zone, consolidates, then pushes through the VWAP and the descending trendline, with accumulation continuing. Trigger: daily close above $17.61 on solid volume. Target: $17.80 first (SMA200D), then $18.40–$18.60. Invalidation: daily close below $15.80 (EMA 21). (50% probability)
- Scenario 2: Neutral Range Consolidation — The stock digests the gap between $16.0 and $17.6, with resistance at the SMA200D/trendline and support at the 50-day and EMA 55. Trigger: failure to close above $17.61 while holding $16.35. Target: $16.40–$17.40. Invalidation: close above $17.85 or below $15.80. (20% probability)
- Scenario 3: Bearish Gap Fill / Lower High — The rally fails at the declining trendline and SMA200D, the MACD histogram rolls over, and price fills the gap toward the EMA 21 and beyond. Trigger: close below $16.35 followed by a break of $15.80. Target: $15.20, then $14.50. Invalidation: close above $17.65. (30% probability)
PRICE TARGETS
- Target Price: $17.45 (27-day)
- Expected Range: $15.60 to $18.40 (width $2.80, about 16.7% of current price, within the 12–18% guidance for 30–60 days, scaled for 27 days)
- Key Levels: Support at $16.35 (EMA 55), Resistance at $17.61 (recent high; the SMA200D at $17.79 sits just above it)
OVERALL BIAS
OVERALL BIAS: BULLISH - A high-volume gap reversal, a fresh MACD bullish cross, CMF accumulation, and +DI over −DI with ADX at 25 favor further upside toward the $17.4–$18 area, though the SMA200D, VWAP, and downtrend line cap the move and keep conviction moderate.
This is educational analysis and not financial advice.