SOXS 27-day bearish forecast — Nov 1, 2026
- Bias: Bearish
- Timeframe: 27 days (made Nov 1, 2026, target date Nov 27, 2026)
- Price at analysis: $52.08
- Price target: $46.50
- Expected range: $42.00 – $51.00
- Result: Pending — graded after the close on Nov 27, 2026
Get a free AI analysis of SOXS today
Analysis
TECHNICAL INDICATORS
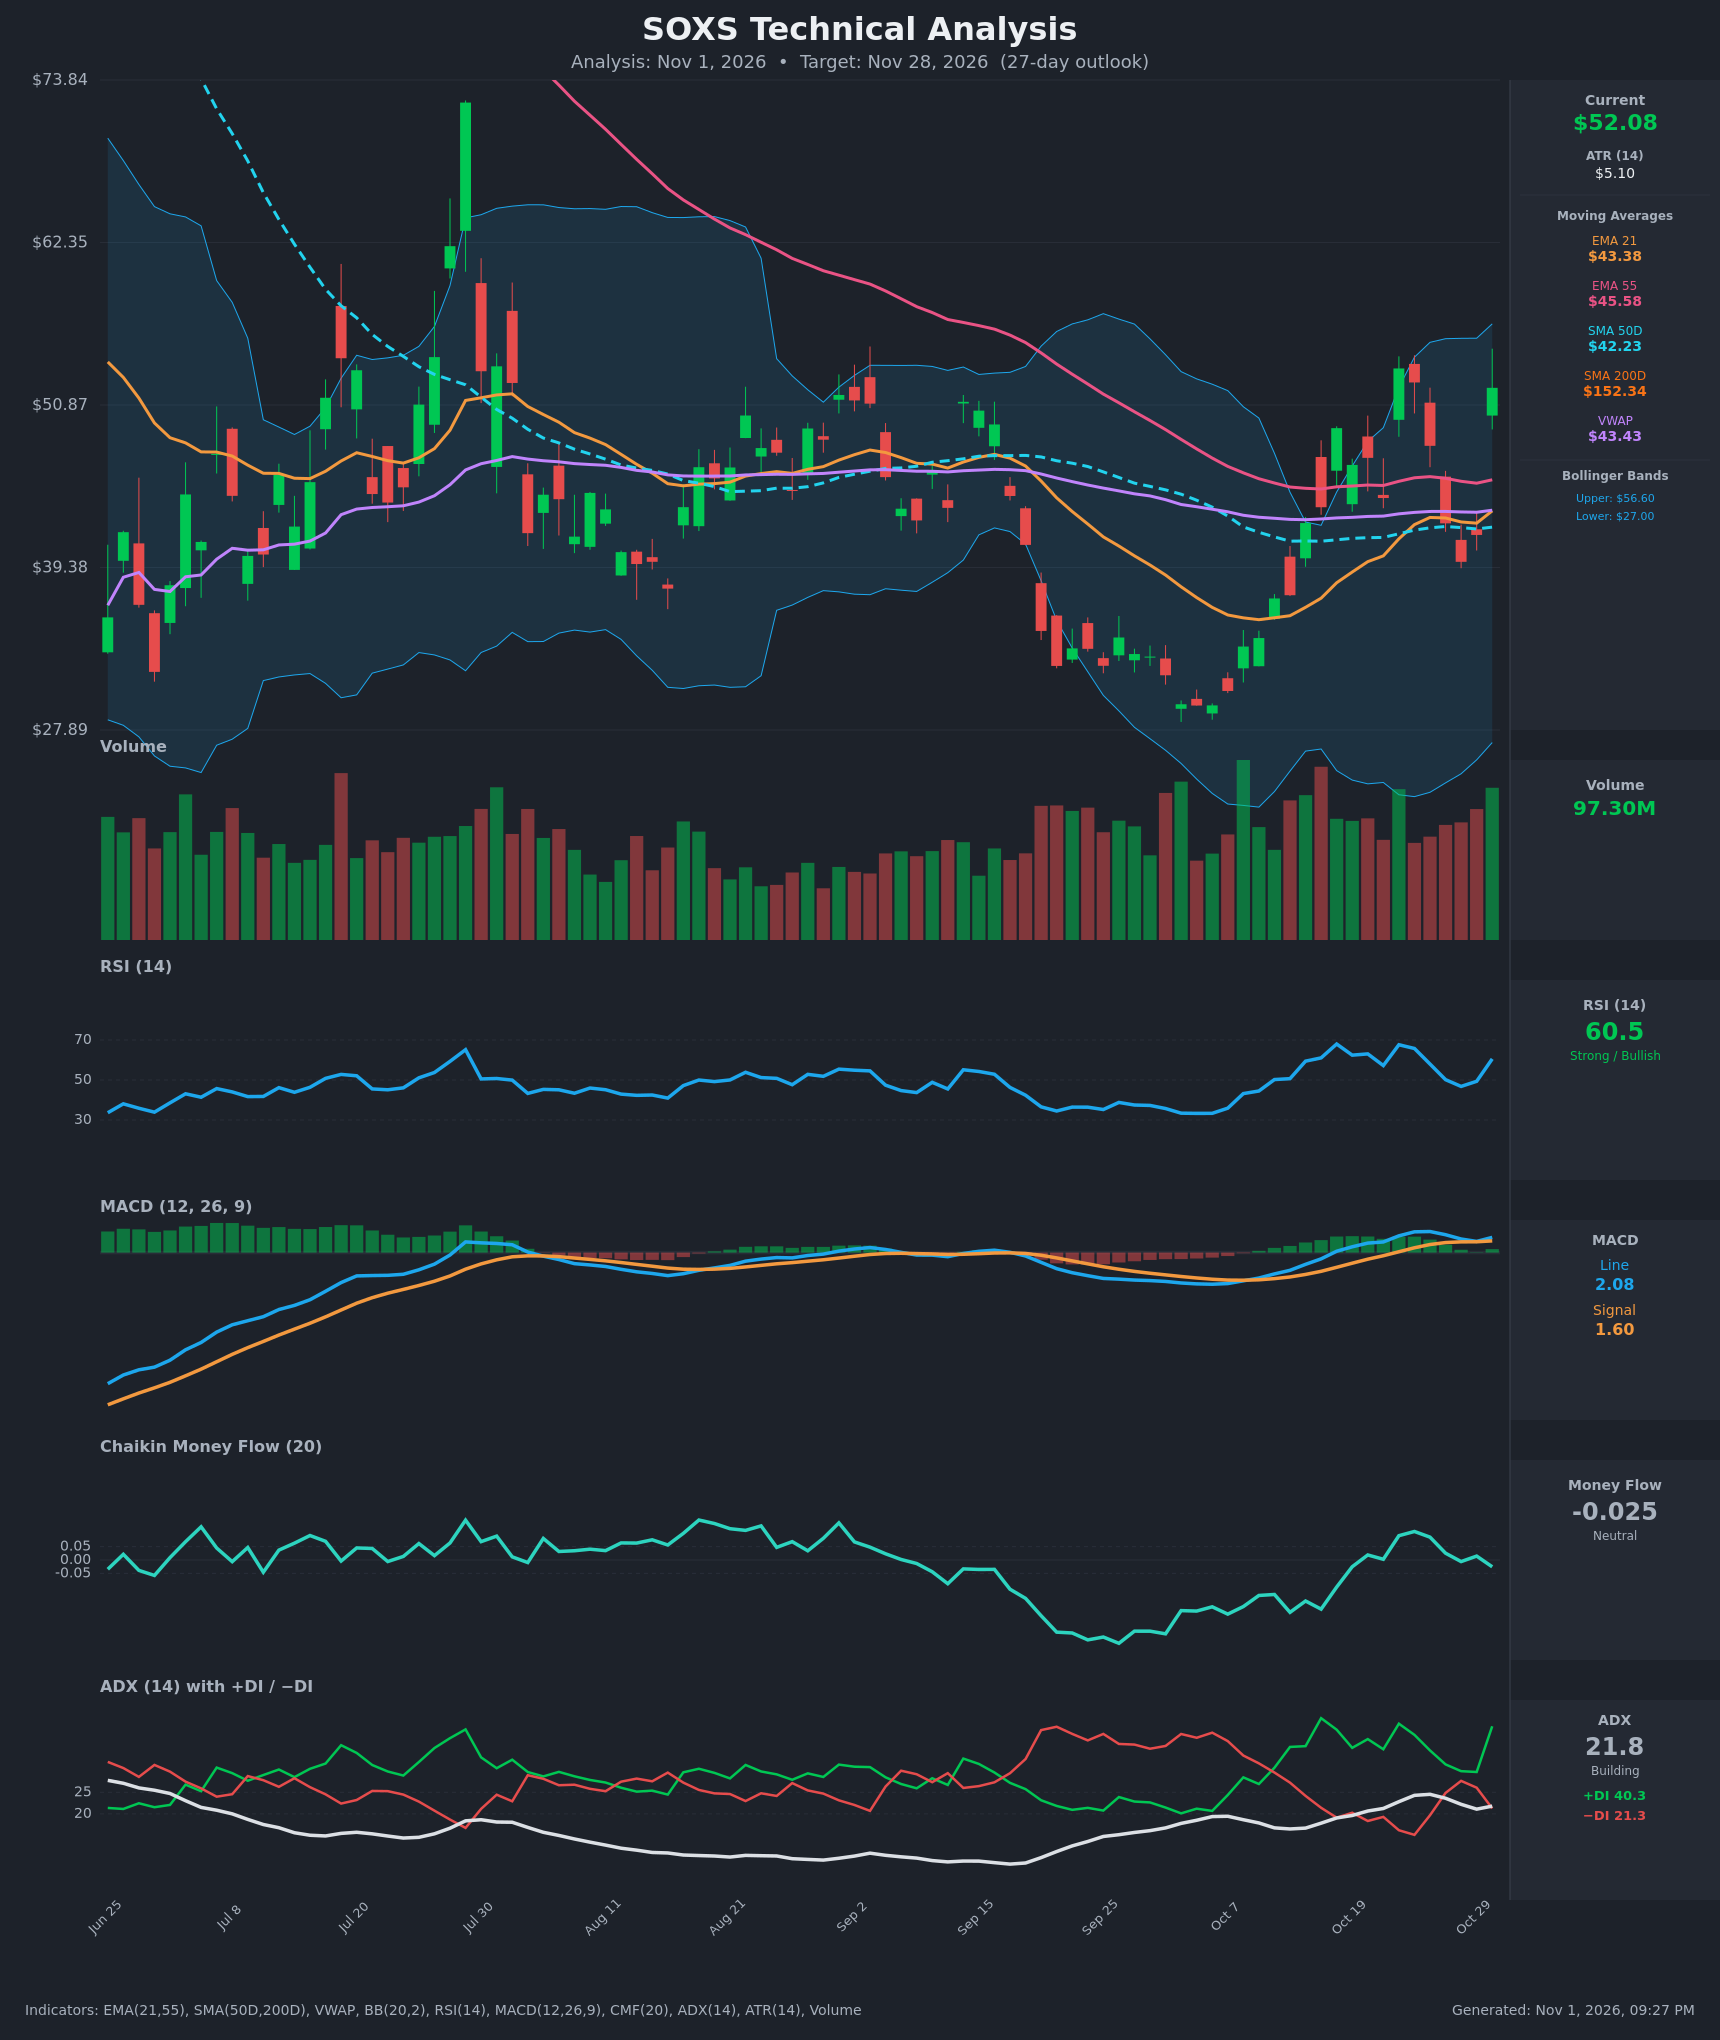
- RSI (14): 60.55, up from 49.4 two sessions ago and below the 67-68 peaks of Oct 16 and Oct 22. Momentum is positive but each push higher has stalled below 70. [Bullish]
- 20 EMA (EMA 21): $43.38, with price about 20% above it. Price is holding above it as support, but the stretch is large. The EMA 21 is still below the EMA 55 ($45.58), so there is no bullish EMA cross yet. [Bullish]
- MACD: Line 2.08 is above signal 1.60 with a small positive histogram. The bullish cross was Oct 22, and the line dipped toward the signal on Oct 29 before rebounding. Momentum is positive but has been choppy, with no clean acceleration. [Bullish]
- Bollinger Bands (20): Upper $56.60, lower $27.00, so the bands are very wide. Price at $52.08 sits in the upper third, about $4.50 below the upper band. Prior touches of the upper zone near $53 reversed quickly. [Neutral]
- CMF (20): -0.025, inside the neutral band. It peaked near +0.1 on Oct 23 and has faded, so rallies are not backed by sustained accumulation. [Neutral]
- ADX (14): 21.8, rising slightly but below 25. +DI 40.3 is far above −DI 21.3, so bulls control direction, but the trend is not yet strong. The Oct 22-26 trend burst failed. [Weak Trend, bullish direction]
- Volume: 97.30M, among the highest recent sessions, on a +25% day. That supports the move, but the long upper wick suggests some supply near $53. [Mixed / mildly bullish]
DIVERGENCES & TRENDS
- Price at $52.08 is near the Oct 22 high of $53.45, but RSI (60.5 vs 67.6) and CMF (-0.025 vs +0.09-0.1) are lower. That is a mild bearish divergence.
- Each rally of the past three weeks has been sharp and then fully retraced: $49.23 → $46.63, $53.45 → $39.78, and now $52.08. This is a high-volatility, mean-reverting range of roughly $39.8-$53.5.
- The SMA50D ($42.23) is far below the SMA200D ($152.34), a death cross already in place and a long-term downtrend. Price is still below the SMA200D by a wide margin.
- Price is above VWAP ($43.43), EMA 21, SMA50D and EMA 55, which is a short-term positive.
- DI spread is wide (+DI 40 vs −DI 21), but the ADX remains below 25.
- MACD is above its signal line with a flat, shallow histogram, so there is no strong momentum expansion.
CHART PATTERNS
- Bearish Double Top (forming): Highs at $53.45 (Oct 22) and $52.08 (Oct 30) bracket a trough near $39.78. A rejection here would put the neckline near $39.8-$40, with a measured target around $27-$28 (the prior low).
- Bearish Rising Wedge / Expanding structure (loose): The wide-swing recovery from the early-October low near $28 has made higher highs and higher lows, but with erratic expanding ranges. It resembles a rising wedge that could resolve lower.
- Bullish counter-case: A close above $53.45 would break the double-top structure and could target $58-$60, near the upper Bollinger Band and the Aug-Sep resistance area.
- Because the double top needs confirmation, the nearer-term expectation is a fade toward the $43-$46 EMA/VWAP cluster rather than a full measured move.
POTENTIAL SCENARIOS
- Scenario 1: Bearish Double-Top Fade / Mean Reversion — Price stalls below $53.45 and reverts toward the EMA 21/VWAP cluster, as in the previous two spikes. The leveraged-ETF decay also leans against holding extended gains. Trigger: rejection at $52-$54 or a close below $47.50. Target: $43.50-$46.50 (a deeper break could reach $40). Invalidation: a daily close above $54. (50% probability)
- Scenario 2: Bullish Breakout Continuation — +DI dominance, a positive MACD and heavy volume carry price through $53.45, and ADX rises above 25. Trigger: a close above $53.50 on strong volume. Target: $57-$60 (upper BB at $56.60). Invalidation: a close back below $47. (33% probability)
- Scenario 3: Neutral Range Chop — Price oscillates in the $42-$53 range with no resolution. Trigger: ADX stays below 25 and CMF stays near zero. Target: $46-$50. Invalidation: a close outside $41-$54. (17% probability)
PRICE TARGETS
- Target Price: $46.50 (27-day horizon, about 10.7% below the current price)
- Expected Range: $42.00 to $51.00 (width $9.00, about 17% of the current price, consistent with the 27-day horizon given SOXS's high volatility, ATR about 10% of price)
- Key Levels: Support at $43.40 (VWAP/EMA 21 cluster), Resistance at $53.45 (Oct 22 high)
OVERALL BIAS
OVERALL BIAS: BEARISH - Price is stretched about 20% above the EMA 21/VWAP after a +25% one-day spike into the $53.45 resistance, with RSI and CMF lagging the prior peak. Every recent spike has retraced, and a potential double top is forming, while the bullish MACD and +DI are offset by a sub-25 ADX and neutral money flow.
This is educational analysis and not financial advice.