SPY 27-day bearish forecast — Nov 1, 2026
- Bias: Bearish
- Timeframe: 27 days (made Nov 1, 2026, target date Nov 27, 2026)
- Price at analysis: $755.72
- Price target: $747.00
- Expected range: $705.00 – $797.00
- Result: Pending — graded after the close on Nov 27, 2026
Get a free AI analysis of SPY today
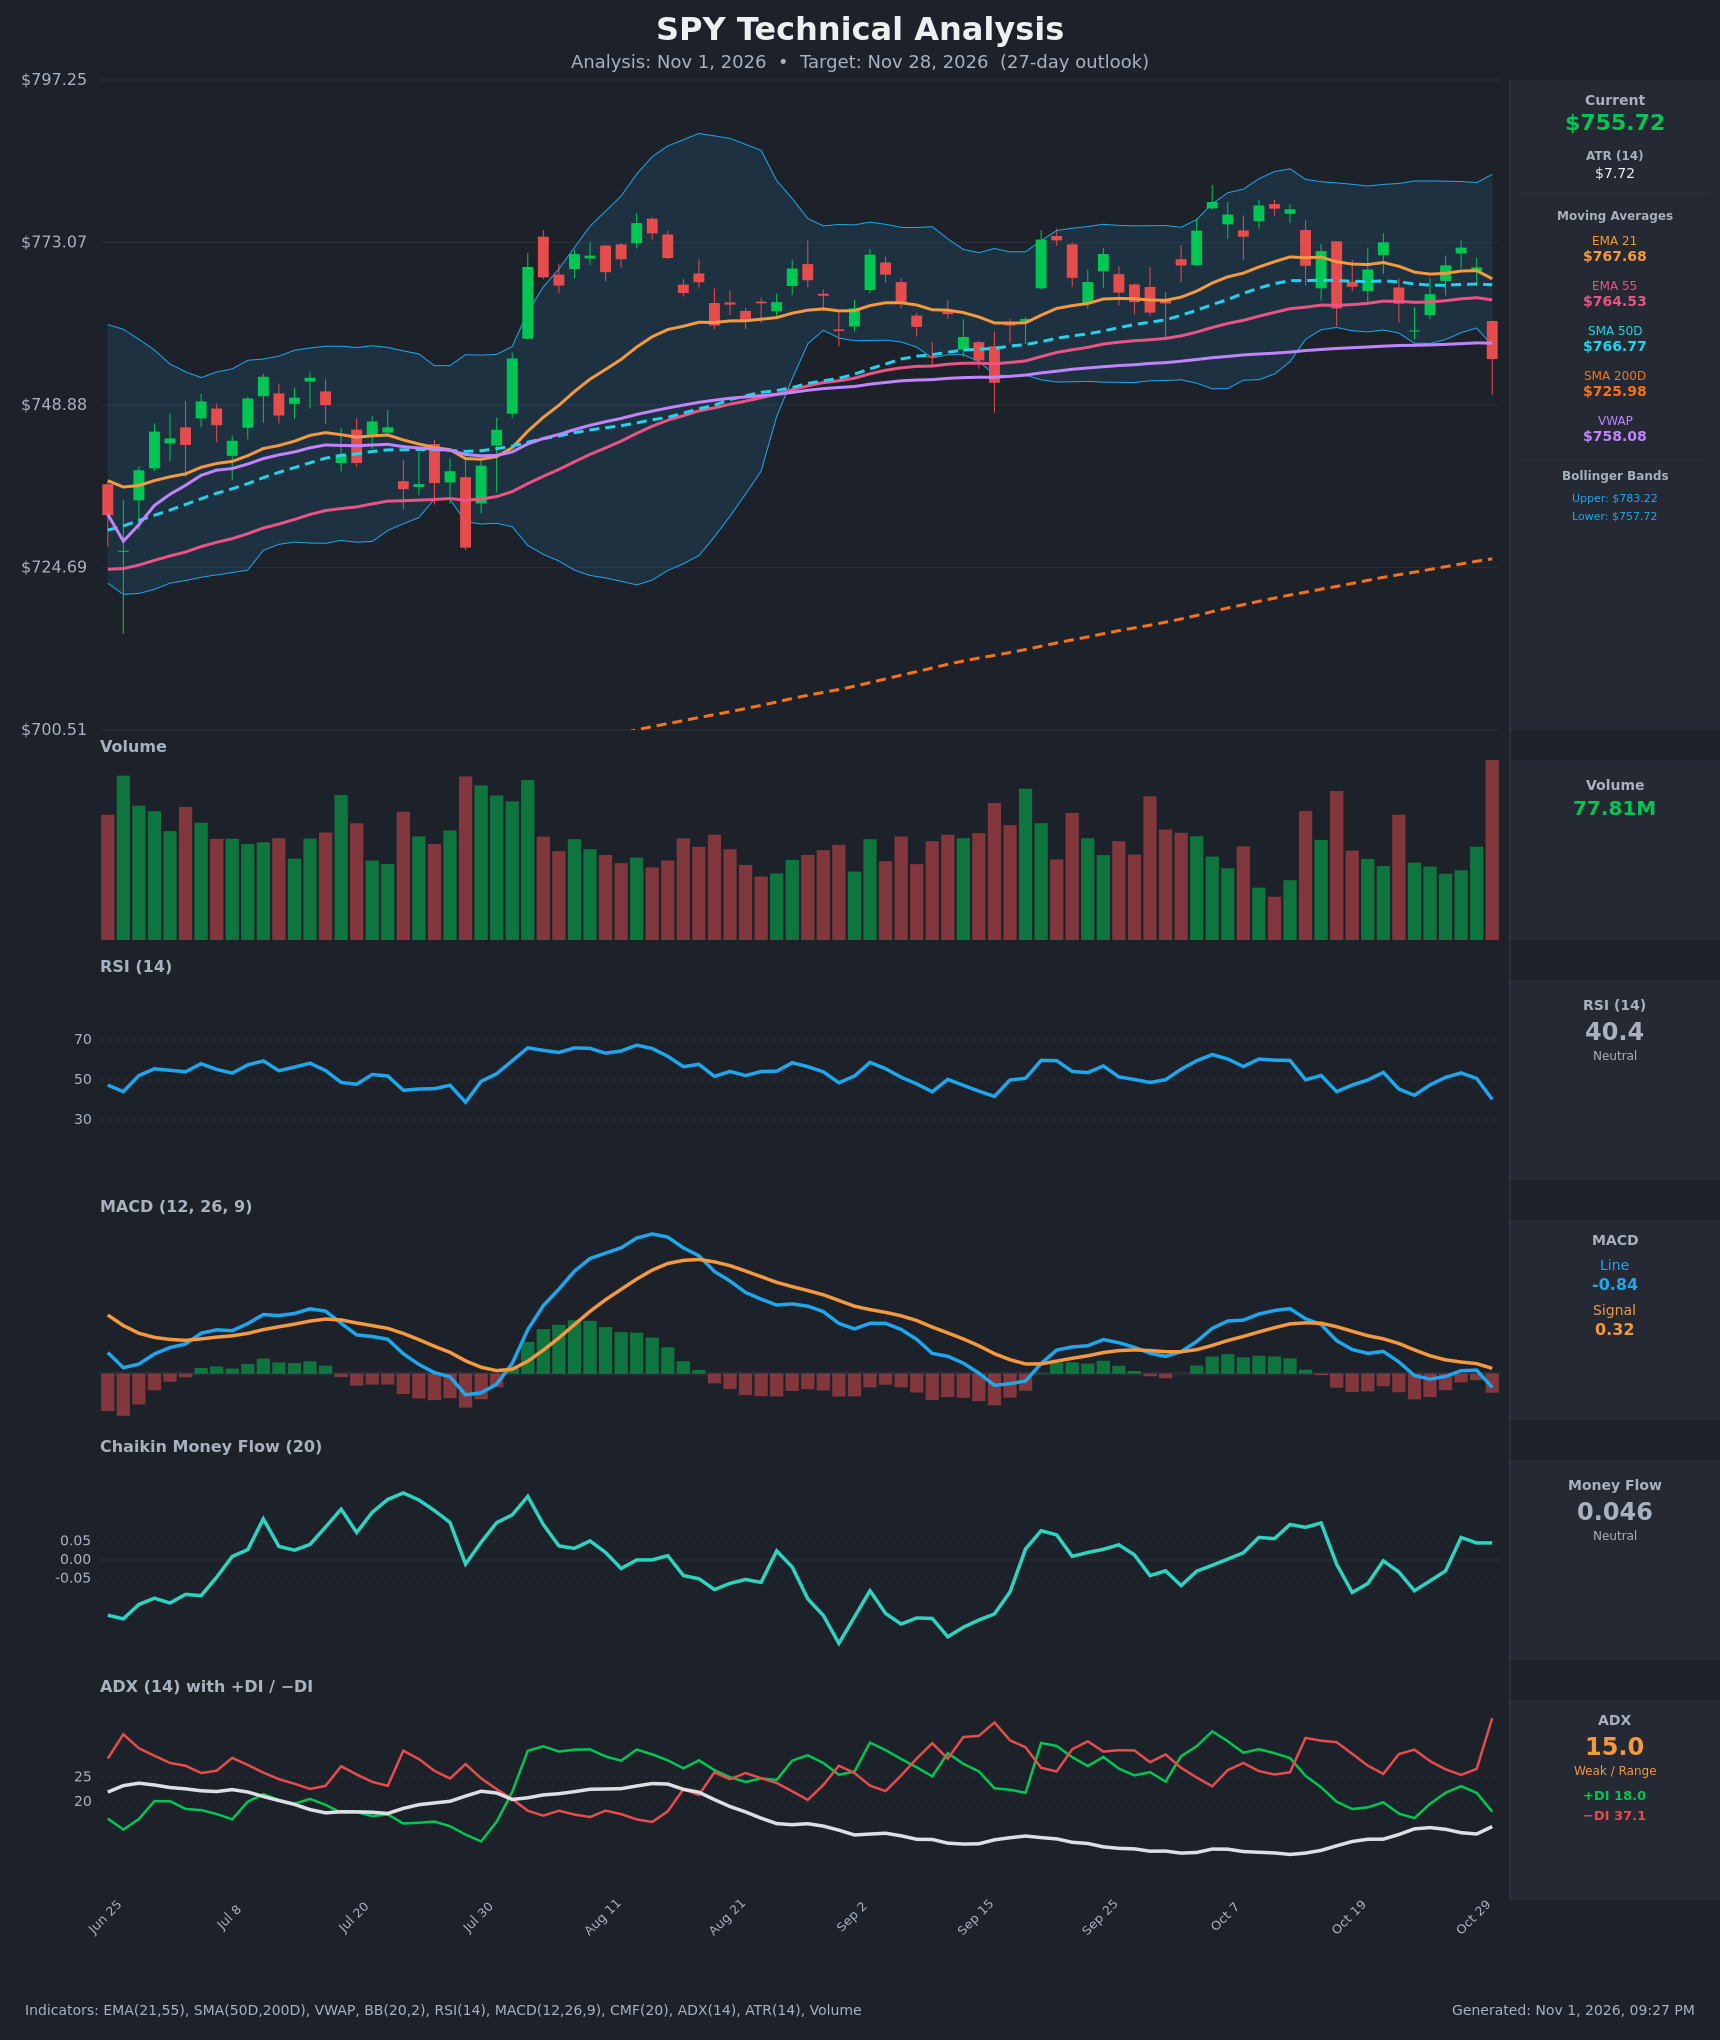
Analysis
TECHNICAL INDICATORS
- RSI (14): 40.36, down sharply from 50.8 the prior day and 53.5 on Oct 28. It is below the 50 midline but well above oversold (30), so momentum is bearish with room to fall further. [Bearish]
- 20 EMA: The EMA 21 is $767.68 and price at $755.72 is about 1.6% below it, so it now acts as overhead resistance. Price lost the EMA21 and EMA55 ($764.53) in one session. The EMA21 is still above the EMA55, so there is no bearish crossover yet, but the gap is narrowing. [Bearish]
- MACD: The line is -0.844 and the signal is +0.324, so the line crossed below the signal on Oct 30 (it had been negative since Oct 23). The histogram is negative and widening. This is a fresh bearish crossover, with the line dipping below zero. [Bearish]
- Bollinger Bands (20): The bands run $757.72 to $783.22. The latest close of $755.72 is below the lower band, a breakdown candle with a long lower wick. That can signal short-term stretch and a snap-back, but it also marks a bearish expansion if the lower band fails to hold. [Bearish]
- CMF (20): 0.046, just under the +0.05 accumulation threshold. It has been oscillating around zero and has not yet reacted to the sell-off. Volume flow is neutral, which is a mild positive against the price drop. [Neutral]
- ADX (14): 15.0 (weak/range-bound) but rising from about 9 earlier in the month. −DI at 37.1 is far above +DI at 18.0, and the −DI spike is the highest in months. The trend is weak but sellers are in control. [Weak Trend, bearish direction]
- Volume: 77.81M, the largest bar in the visible window, on a large red candle. High-volume breakdowns usually reflect real distribution. It could also be a capitulation or exhaustion bar, given the close below the lower Bollinger Band. [Bearish – heavy selling volume]
DIVERGENCES & TRENDS
- There is no clear divergence. RSI and MACD confirm the price decline, and RSI made a lower high (about 53 against 60 earlier in October) as price made lower highs near $772.
- CMF at +0.046 is holding up better than price, a mild bullish divergence that tempers the bearish read.
- MACD crossed below its signal and the zero line within a week, and the histogram has been red since Oct 23.
- Price is now below the EMA21, EMA55, SMA50 ($766.77), VWAP ($758.08) and the lower Bollinger Band. The moving averages are clustered at $764–768 and now form a resistance zone.
- Price remains well above the SMA200 ($725.98), so the long-term uptrend is intact. The SMA50 is above the SMA200, so there is no death cross.
- The 15-day closing range of about $760–778 has been broken to the downside in a single bar.
CHART PATTERNS
- Bearish Triple Top (loosely) / range breakdown: Highs have repeatedly stalled around $775–780 (Aug, Sep and Oct), with support around $750–757. The Oct 30 close pierced the lower part of that range.
- The measured move from the range (about $26–28 height) projects to roughly $725–730. This coincides with the rising SMA200 at about $726, a strong confluence zone.
- A bounce back into $764–768 (EMA55/SMA50/EMA21) would be a typical retest of the breakdown. A weak, low-ADX retest could set up a bearish continuation.
- Failure of the breakdown, with a reclaim of $768, would turn this into a range-bound consolidation or a false breakdown.
POTENTIAL SCENARIOS
- Scenario 1: Bearish Range Breakdown Continuation — Heavy-volume selling, −DI dominance and the MACD bearish cross point to a test of the Aug/Sep lows and possibly the SMA200. Trigger: close below $750 with RSI under 40. Target: $748, then $730 and the $726 SMA200 area. Invalidation: daily close back above $768 (EMA21/SMA50). (50% probability)
- Scenario 2: Bullish Snap-Back / False Breakdown — The close below the lower Bollinger Band, neutral CMF and long lower wick bring a mean-reversion bounce back to the moving-average cluster. Trigger: reclaim of $758 (VWAP) and then $765. Target: $767–775. Invalidation: close below $748. (30% probability)
- Scenario 3: Neutral Range Chop — Weak ADX (15) keeps price oscillating between $748 and $768 for most of the month. Trigger: repeated failures at $768 and holds above $748. Target: $750–765. Invalidation: decisive break outside $745–772. (20% probability)
PRICE TARGETS
- Target Price: $747.00 (27-day horizon)
- Expected Range: $705.00 to $797.00 (width $92, about 12.2% of the current price, in line with 30–60 day guidance)
- Key Levels: Support at $748.00 (prior Aug/Sep swing lows), with deeper support at $725.98 (SMA200). Resistance at $766.77 (SMA50, with EMA55/EMA21 just above at $764.53/$767.68).
OVERALL BIAS
OVERALL BIAS: BEARISH - A high-volume close below the lower Bollinger Band and all key moving averages, a fresh bearish MACD cross, RSI falling to 40, and −DI at 37 against +DI at 18 favor further downside toward the $725–748 zone. Conviction is modest because ADX is only 15, CMF is neutral and price is still above the SMA200.
This is educational analysis and not financial advice.