IBM 34-day bullish forecast — Nov 1, 2026
- Bias: Bullish
- Timeframe: 34 days (made Nov 1, 2026, target date Dec 4, 2026)
- Price at analysis: $257.81
- Price target: $266.00
- Expected range: $236.00 – $279.00
- Result: Pending — graded after the close on Dec 4, 2026
Get a free AI analysis of IBM today
Analysis
TECHNICAL INDICATORS
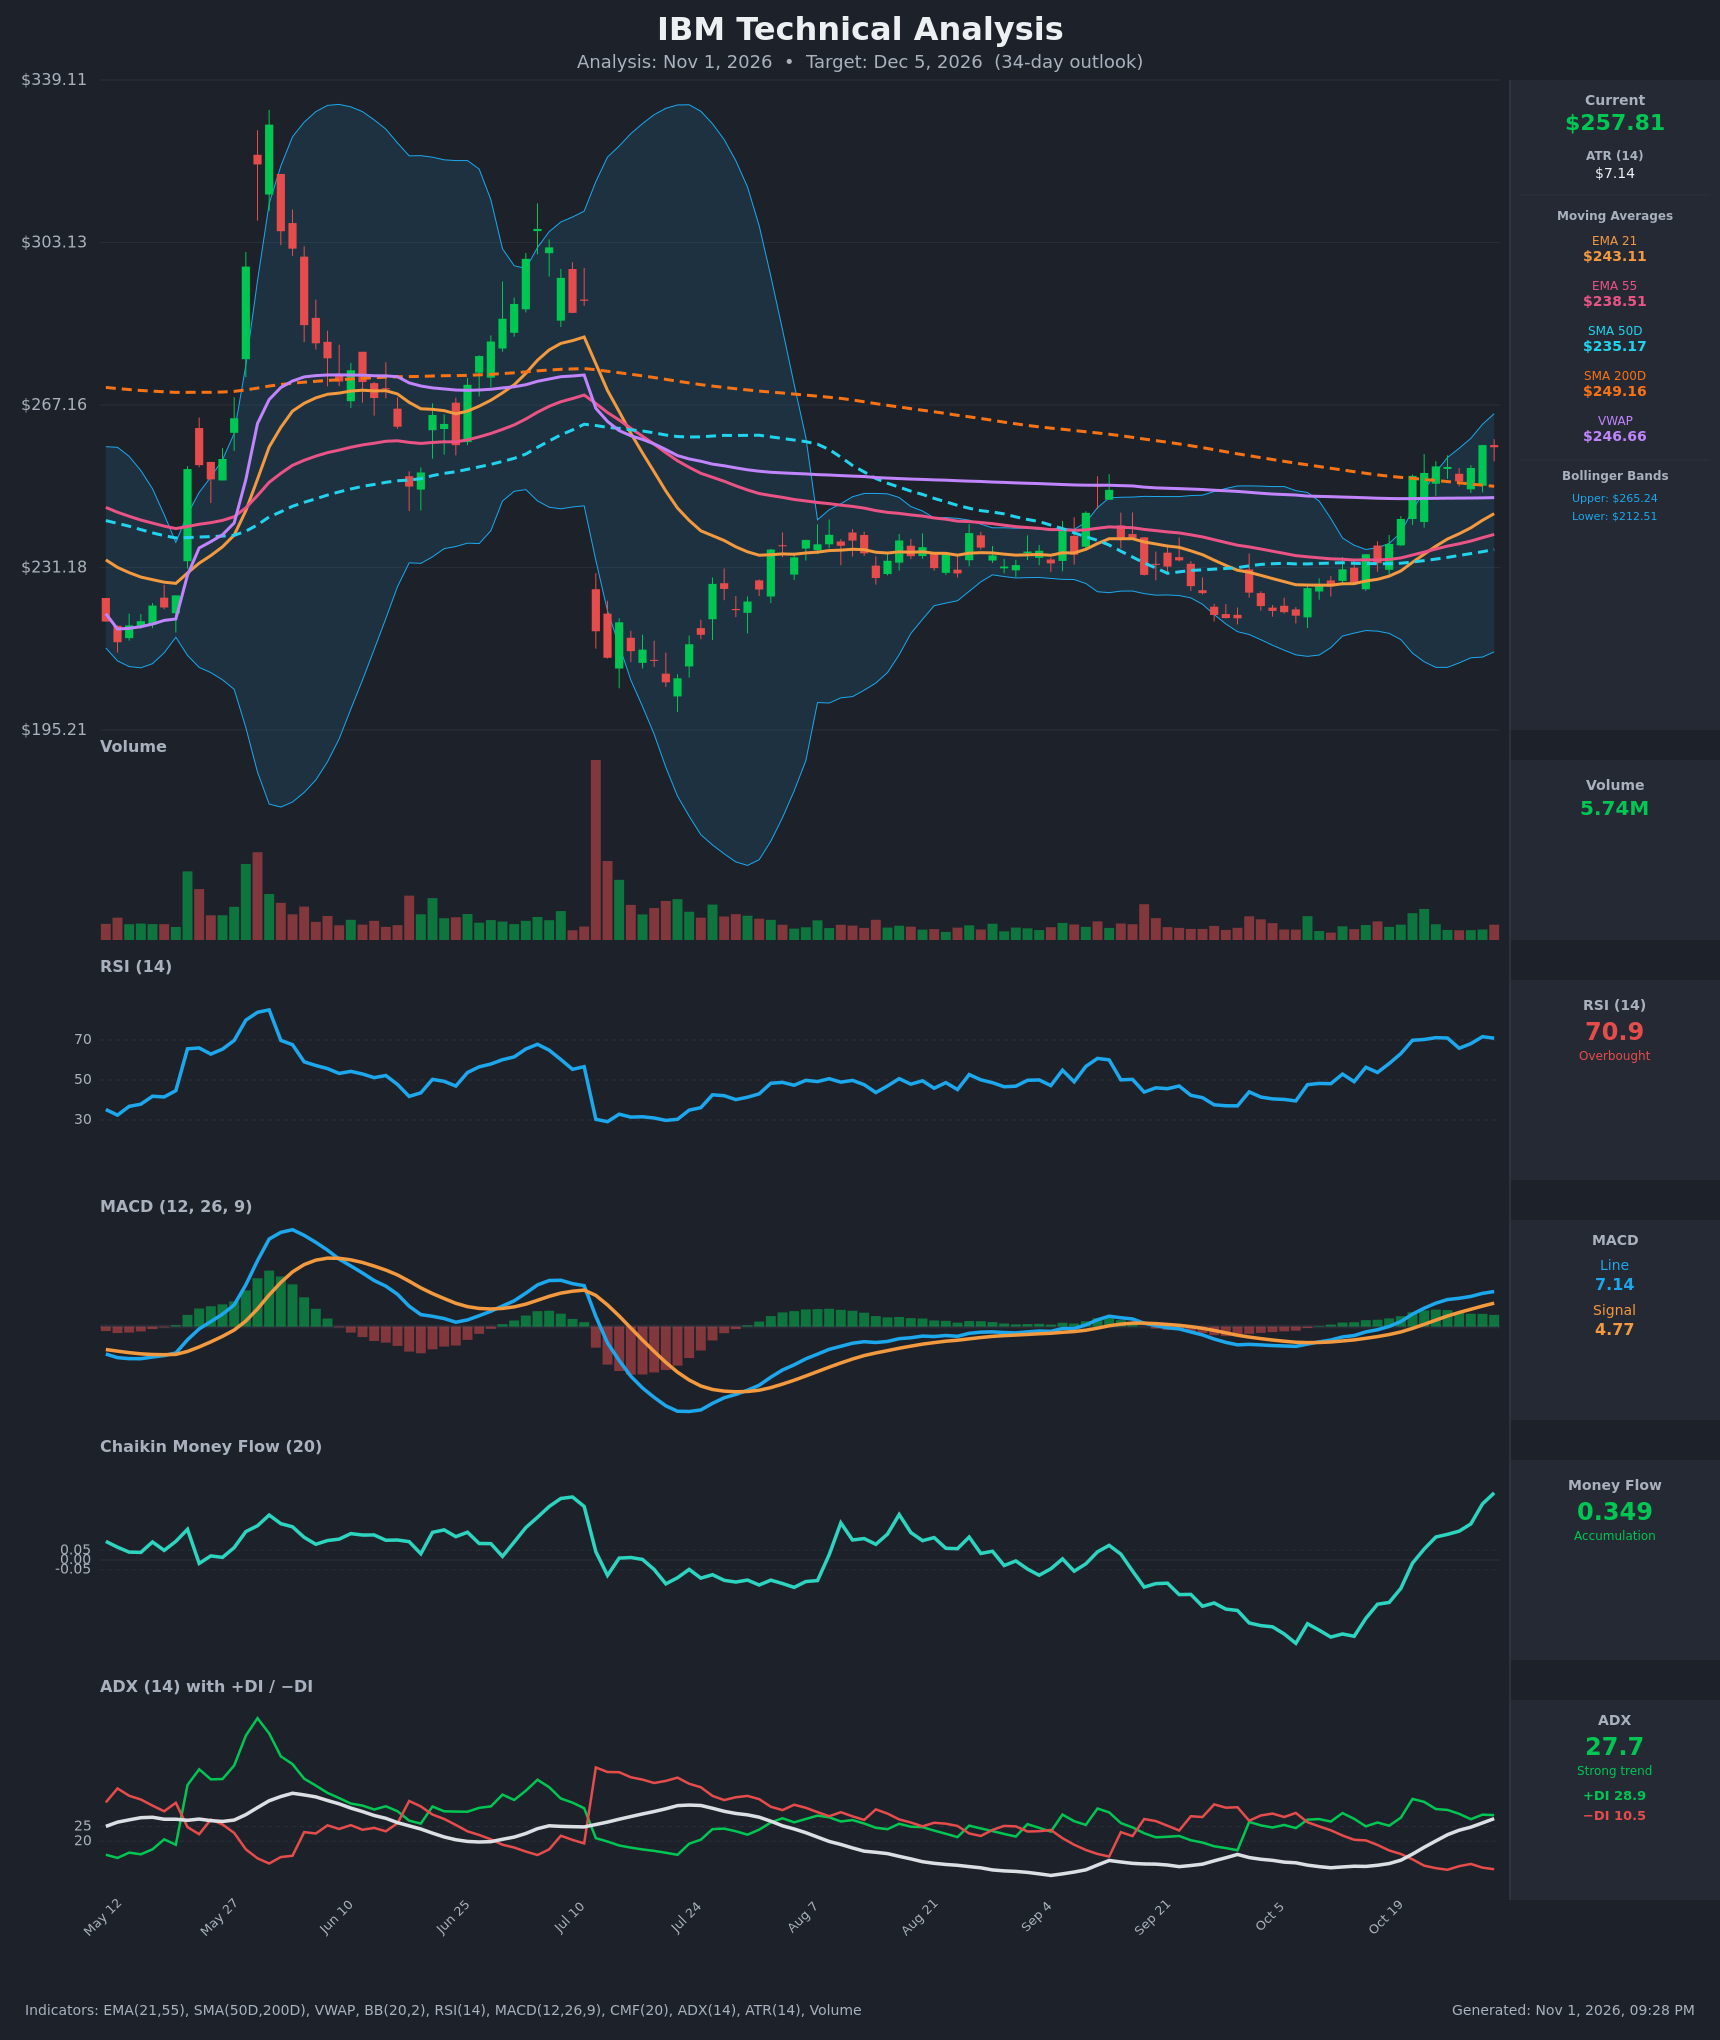
- RSI (14): 70.89, just into overbought territory. It has climbed from 48 on Oct 12 to a 70-71 plateau since Oct 21. Momentum is strong, but the flat reading near 70 suggests some near-term exhaustion risk. [Bullish]
- 20 EMA (EMA 21 = $243.11): Price at $257.81 is about 6% above it, and the EMA is rising steeply. EMA21 has crossed above EMA55 ($238.51) as of Oct 23. This is a bullish crossover, and the EMA now acts as dynamic support. [Bullish]
- MACD: Line 7.14 is above signal 4.77. The MACD crossed up on Oct 22 and the histogram (+2.37) has been expanding, with both lines positive. [Bullish]
- Bollinger Bands (20): Upper $265.24, lower $212.51, so the bands are wide (~$52). Price is in the upper quarter of the band, about $7.4 below the upper band and well above the midline (~$239). That is a strong-trend "band walk" position, but not yet a breakout. [Bullish]
- CMF (20): 0.349, a strong accumulation reading. It has risen from -0.40 on Oct 12 to well above +0.05, confirming that buyers are driving the rally. [Accumulation]
- ADX (14): 27.7 and rising, above the 25 threshold. +DI (28.9) is far above −DI (10.5), so there is a strong uptrend with bulls firmly in control. [Strong Trend – Bullish]
- Volume: 5.74M, modest compared with the spikes in May and July. The Oct 21 breakout bar showed higher volume, but participation has been average since. Volume doesn't fully confirm the rally, though CMF remains strong. [Neutral to mildly Bullish]
DIVERGENCES & TRENDS
- No bearish RSI/price divergence yet. RSI has plateaued at ~70-71 while price made a marginally higher high at $258.28 on Oct 29, a mild flattening worth watching.
- Price is now above SMA200D ($249.16), a long-term trend reclaim. SMA200D is still declining, while SMA50D ($235.17) is rising and has turned up. A golden cross is not close (a ~$14 gap), but the gap is narrowing.
- Price is above VWAP ($246.66) and every moving average, with a bullish stack: price > EMA21 > EMA55 > SMA50D.
- ADX rose from 11 to 27.7 as the range gave way to a trend. The DI spread is wide and +DI is dominant.
- Price has risen ~13.5% in 14 sessions, which is extended, so a consolidation or pullback toward EMA21 is plausible.
- The upper Bollinger Band ($265) and the early-June swing zone (~$267-$270) form near-term resistance, and the chart shows previous supply near $267.
CHART PATTERNS
- Bullish base breakout / range breakout: From August to October price consolidated in a narrow $215-$240 range (similar to a Bullish Triple Top/range base in the reference diagram, which resolves upward). The Oct 21 breakout from this base, with a gap above the 200-day SMA, is bullish.
- Measured move: The base is ~$25 tall, from ~$217 to ~$240. Projecting from the breakout level (~$240-$250) gives ~$265-$275, in line with the upper band and prior resistance.
- Recent candles near $250-$258 look like a short bullish flag/consolidation just under the 200-day SMA and above it, a continuation setup.
- Overhead resistance is at $265-$270, with the major supply zone at $280-$300 from the May-June highs.
POTENTIAL SCENARIOS
- Scenario 1: Bullish Continuation Breakout — Price consolidates briefly above the 200-day SMA, then pushes through the upper Bollinger Band and prior swing resistance, supported by strong CMF and ADX. Trigger: daily close above $265.25 with expanding volume. Target: $272-$280. Invalidation: close below $249 (SMA200D). (50% probability)
- Scenario 2: Bullish-Leaning Pullback and Resume — RSI overbought and the extended move lead to a pullback toward EMA21/VWAP ($243-$250), where buyers defend the breakout before the uptrend resumes. Trigger: rejection at $265 and RSI dropping below 60. Target: a dip to $245-$250, then a recovery to ~$258-$262 by early December. Invalidation: close below $240. (30% probability)
- Scenario 3: Bearish Failed Breakout — The rally is a bull trap, as volume is only average. Price loses the 200-day SMA and falls back into the old $230-$240 range. Trigger: close below $243 with MACD histogram turning negative. Target: $232-$238. Invalidation: reclaim of $258 on good volume. (20% probability)
PRICE TARGETS
For 34 days, the range width should be ~12-18% of the current price ($257.81). Range: $236.00 to $279.00 = $43.00 width = 16.7%, which fits.
- Target Price: $266.00 (34-day)
- Expected Range: $236.00 to $279.00
- Key Levels: Support at $249.16 (SMA200D; next at $243.11 EMA21), Resistance at $265.24 (upper Bollinger Band; next at ~$280)
OVERALL BIAS
OVERALL BIAS: BULLISH - Price has broken out of a multi-month base, reclaimed the 200-day SMA, and sits above a fully bullish MA stack, with MACD, a strong ADX/+DI, and heavy CMF accumulation all aligned. Overbought RSI and only average volume argue for a possible pullback, but the trend evidence favors higher prices over the 34-day horizon.
This is educational analysis and not financial advice.