F 34-day bullish forecast — Nov 1, 2026
- Bias: Bullish
- Timeframe: 34 days (made Nov 1, 2026, target date Dec 4, 2026)
- Price at analysis: $12.25
- Price target: $12.70
- Expected range: $11.70 – $13.40
- Result: Pending — graded after the close on Dec 4, 2026
Get a free AI analysis of F today
Analysis
TECHNICAL INDICATORS
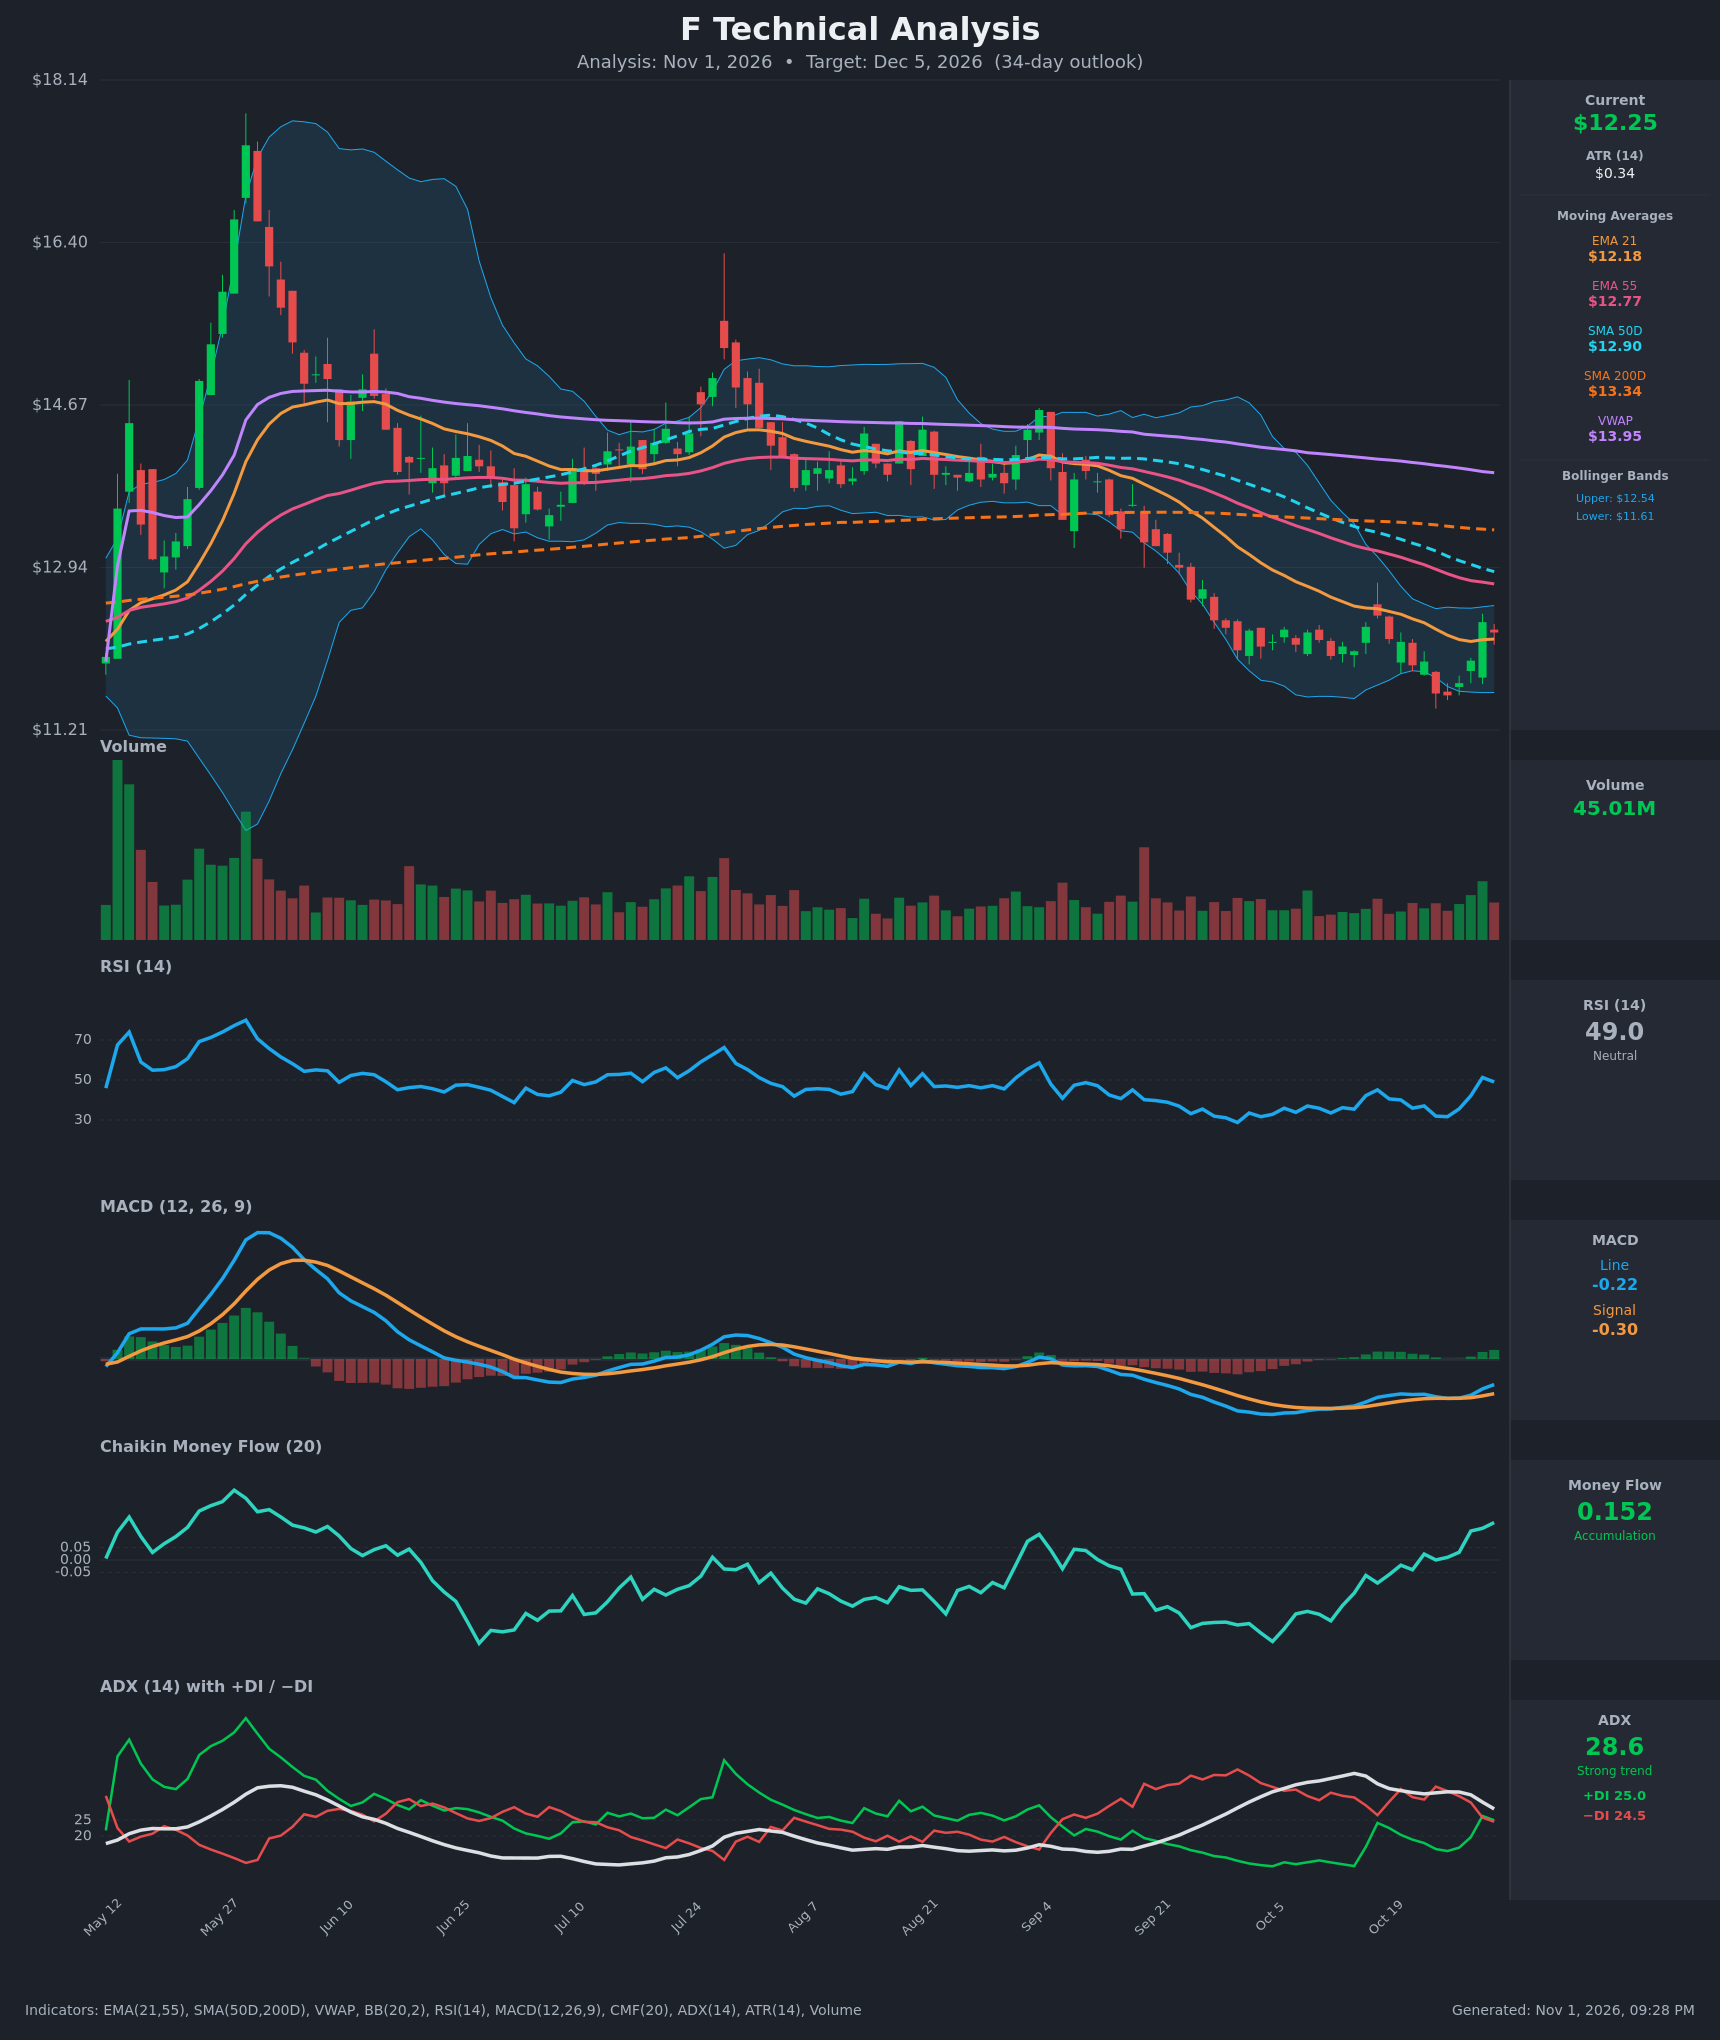
- RSI (14): 49.02, up from the 31.7 low on Oct 26 and now sitting at the 50 midline. It peaked at 51.3 on Oct 29 and ticked down slightly. Momentum has reset from oversold to neutral. [Neutral]
- 20 EMA (EMA 21 = $12.18): Price at $12.25 is just above the EMA21 after reclaiming it on Oct 29, so it now acts as first support. The EMA21 is still falling and sits below the EMA55 ($12.77), so the medium-term structure is still bearish. [Neutral]
- MACD: Line -0.224 is above Signal -0.304, with a positive and rising histogram. The bullish crossover occurred around Oct 26. Both lines are still below zero, so this is a recovery within a larger downtrend and not yet a trend reversal. [Bullish]
- Bollinger Bands (20): Upper $12.54, lower $11.61, midline about $12.07. Price is in the upper half of the bands after bouncing from the lower band. The bands are fairly tight after the sell-off, and a walk toward the upper band is plausible. [Bullish]
- CMF (20): 0.152, well above +0.05 and rising steadily from -0.25 on Oct 12. Buying pressure has been building during the base, a constructive divergence against the lower price lows. [Accumulation]
- ADX (14): 28.6 and falling from 39.7. +DI 25.0 is barely above −DI 24.5 after a bullish DI crossover on Oct 29. The prior downtrend is losing strength and control is balanced, so this is a trend in transition. [Strong but weakening trend, turning neutral to bullish]
- Volume: 45.01M, with the latest green candle on above-average volume (larger than most recent bars). Buyers are stepping in on the bounce. [Bullish confirmation, modest]
Moving averages and VWAP:
- Price is below the EMA55 ($12.77), SMA50D ($12.90), SMA200D ($13.34) and VWAP ($13.95).
- The death cross (SMA50D below SMA200D) is already in place.
- All of these act as overhead resistance. The EMA55 and SMA50D are the first hurdles.
DIVERGENCES & TRENDS
- Bullish CMF/RSI divergence: Price made a lower low (~$11.58 in late Oct), but CMF rose from -0.25 to +0.15 and RSI bottomed in the low 30s before recovering. Accumulation is occurring at the lows.
- Crossovers: Bullish MACD signal-line cross, bullish +DI/−DI cross (marginal), and price reclaiming the EMA21.
- Bearish backdrop: EMA21 < EMA55 < SMA50D < SMA200D < VWAP is a fully bearish stack, and all of these averages are still sloping down. ADX remains above 25, which reflects the prior downtrend.
- Trend in the indicators: Momentum (RSI, MACD, CMF) has turned up while trend strength (ADX) fades. This usually marks a base or relief rally, not yet a confirmed uptrend.
CHART PATTERNS
- Bullish Double Bottom (loose): Lows near $11.58 (Oct 26) and a higher low near $11.71 (Oct 27). Price has broken above the intermediate neckline around $12.15–$12.40 with rising CMF. The measured move points toward roughly $12.9, which coincides with the SMA50D.
- Bullish Falling Wedge / base context: The Sept–Oct decline had narrowing, lower-high structure into the lows, and a break above the short-term downtrend is consistent with a falling-wedge resolution.
- Caveat: The pattern sits below major resistance (EMA55, SMA50D, SMA200D). A failure back under $11.58 would instead resolve as a bearish continuation.
POTENTIAL SCENARIOS
- Scenario 1: Bullish Base Breakout and Move to Moving-Average Resistance — Accumulation (CMF +0.15) and the MACD/DI crosses carry price above the BB upper band and into the EMA55/SMA50D cluster. Trigger: daily close above $12.54 (upper Bollinger Band) on solid volume. Target: $12.77 (EMA55) first, then $12.90–$13.30 (SMA50D/SMA200D). Invalidation: daily close below $11.90. (50% probability)
- Scenario 2: Bearish Failure at Resistance — The rally stalls at the EMA55/SMA50D, which are still falling, and the bearish MA stack reasserts itself, with ADX re-expanding on −DI. Trigger: rejection at $12.77–$12.90 followed by a close below the EMA21 (~$12.18). Target: $11.60, with an extension to $11.30 if it breaks. Invalidation: close above $12.95. (30% probability)
- Scenario 3: Neutral Range Consolidation — Price chops between the EMA21 and the EMA55 as ADX continues to fade. Trigger: failure to break $12.54 or $11.90. Target: $12.00–$12.60 range. Invalidation: close outside $11.75–$12.80. (20% probability)
PRICE TARGETS
Timeframe: 34 days, which falls in the 30-60 day band (~12-18% width). ATR of $0.34 supports a range of this size over about 34 sessions.
- Target Price: $12.70 (about +3.7% from $12.25)
- Expected Range: $11.70 to $13.40 (width $1.70 = 13.9% of current price, consistent with the 30-60 day guidance)
- Key Levels: Support at $11.60, Resistance at $12.77
OVERALL BIAS
OVERALL BIAS: BULLISH - Momentum and money flow have turned up from the lows (MACD bullish cross, CMF +0.15 accumulation, +DI/−DI cross, price back above the EMA21), and a loose double-bottom base points to a retest of the EMA55/SMA50D zone near $12.77–$12.90. Conviction is modest because price is still below every longer-term average and VWAP, so upside should meet heavy overhead resistance.
This is educational analysis and not financial advice.