HOOD 34-day bullish forecast — Nov 1, 2026
- Bias: Bullish
- Timeframe: 34 days (made Nov 1, 2026, target date Dec 4, 2026)
- Price at analysis: $84.99
- Price target: $90.50
- Expected range: $78.00 – $93.50
- Result: Pending — graded after the close on Dec 4, 2026
Get a free AI analysis of HOOD today
Analysis
TECHNICAL INDICATORS
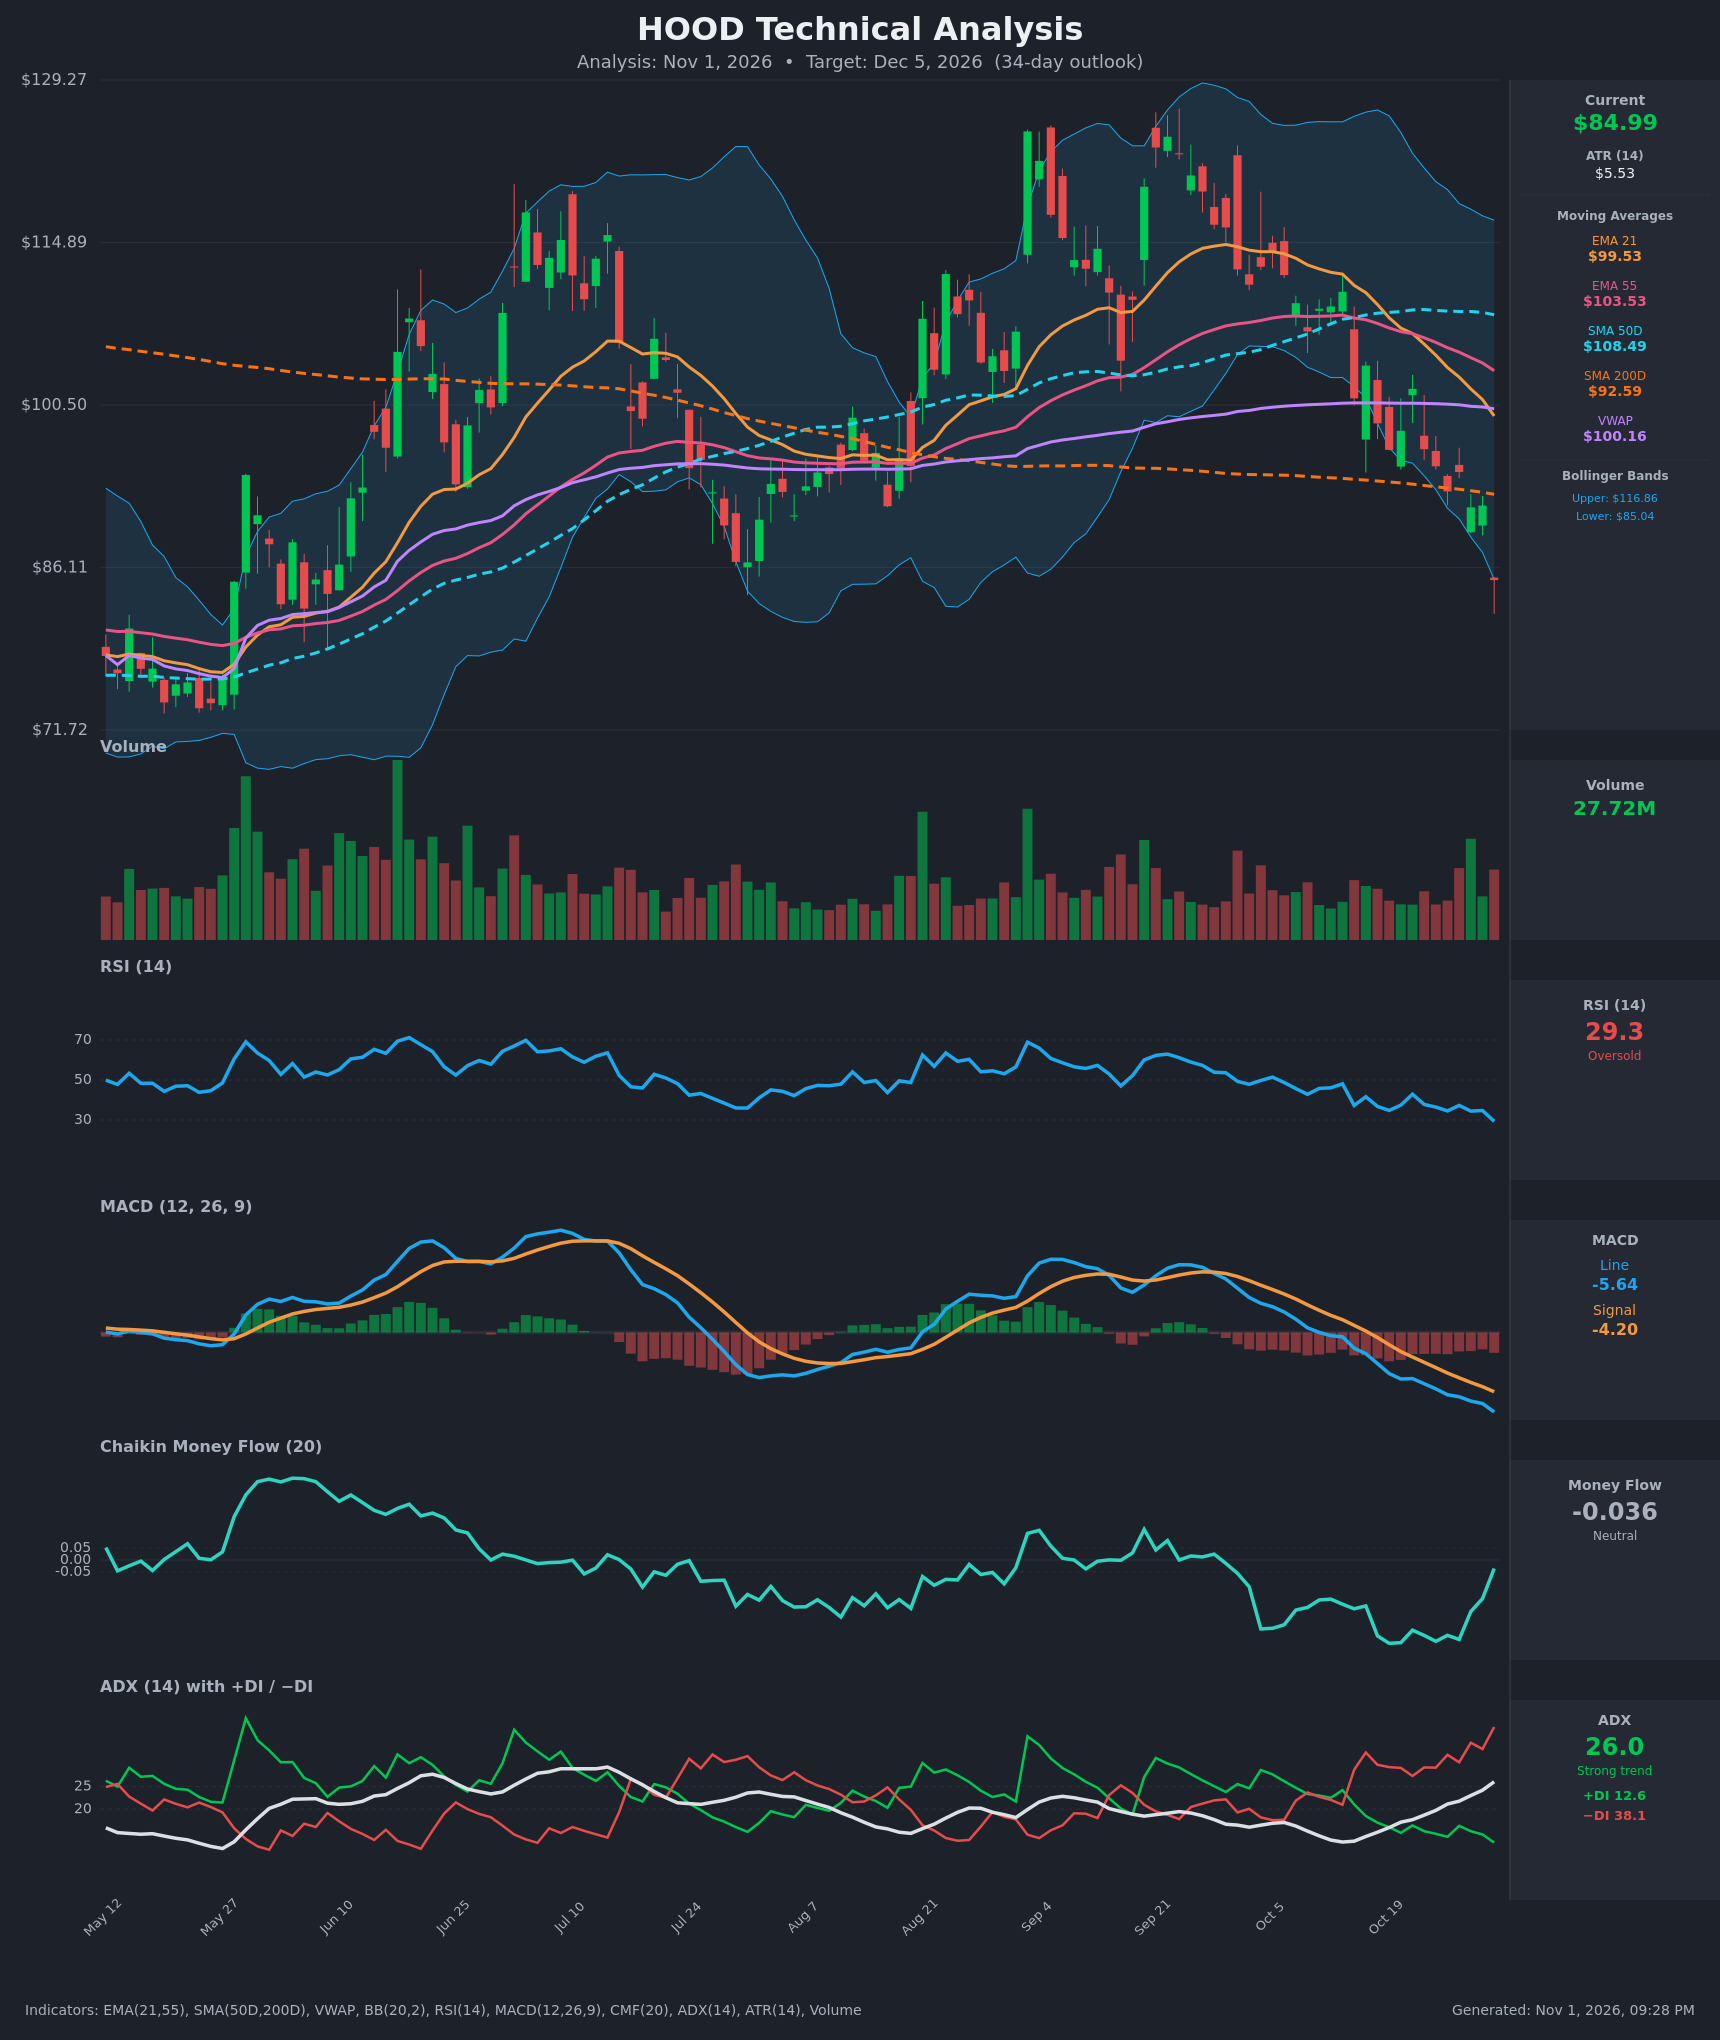
- RSI (14): 29.3, in oversold territory. It has fallen from 48 on Oct 13 and is making lower lows in a steady downtrend. Oversold readings in strong trends can persist, but this is the first sub-30 print in this window and raises the odds of a relief bounce. [Bullish]
- 20 EMA: The EMA 21 is $99.53 and price ($84.99) is about 14.6% below it. The EMA 21 crossed below the EMA 55 ($103.53) around Oct 22, and both are sloping down, so they act as overhead resistance. [Bearish]
- MACD: The line is -5.64 and the signal is -4.20. The line crossed below the signal on Oct 16 and the gap keeps widening, with the histogram increasingly negative. There is no sign of momentum turning yet. [Bearish]
- Bollinger Bands (20): Price is $84.99 against a lower band of $85.04, so it sits right on or just below the lower band. The upper band is $116.86, and the bands are wide after the recent volatility. The last candle has a long lower wick, which shows rejection of the lows. This is a stretched condition that favors a snap-back toward the mid-band, though price can "walk the band" in a strong trend. [Bullish]
- CMF (20): -0.036, in the neutral zone (between -0.05 and +0.05). It has risen sharply from -0.35 on Oct 19, so selling pressure is fading even as price makes new lows. [Neutral]
- ADX (14): 26.0 and rising, which marks a strong trend. −DI (38.1) is far above +DI (12.6), so bears are firmly in control. The −DI/+DI spread is wide, which is typical of late-stage trend legs as well as early ones. [Strong Trend – Bearish]
- Volume: 27.72M, above the recent average, and it comes with the biggest daily drop (-7.2%) of the leg. The long lower wick suggests possible capitulation, but it is not confirmed until follow-through buying appears. [Mixed / Possible capitulation]
Other context:
- Price vs SMA200D: Price is below the SMA200D ($92.59), and it has also lost the VWAP ($100.16) and SMA50D ($108.49).
- SMA50D vs SMA200D: The SMA50D is still above the SMA200D, so there is no death cross yet, but the gap is closing.
DIVERGENCES & TRENDS
- CMF: It has risen from about -0.35 to -0.036 while price made new lows. This is a mild bullish divergence, showing selling pressure waning.
- RSI: There is no clear divergence yet. It is making lower lows with price, so momentum is confirming the decline.
- MACD: It is still accelerating lower with no divergence.
- Recent crossovers:
- The EMA 21 crossed below the EMA 55 (~Oct 22).
- MACD crossed below its signal (Oct 16).
- −DI crossed above +DI (Oct 14).
- Price fell below the SMA200D this week.
- Trend: Price has fallen from about $110 to $85 (about -23%) in 13 sessions. The $84–86 area is also where the late-July swing low held.
CHART PATTERNS
- Established downtrend: Lower highs and lower lows are tracing a descending move. It resembles a Bearish Pennant/Flag continuation that broke down from the $100–110 consolidation. The measured move points to the low $80s or high $70s if the break extends.
- Possible Bullish Double Bottom: The July low (~$84–86) and the current low form a potential double-bottom base. Confirmation needs a reclaim of the neckline near the $92.59 SMA200D / $95–96 area. The pattern is not yet confirmed, and a close below about $80 would negate it.
- Takeaway: The structure is a sell-off into major support at an oversold extreme, so a relief bounce is more probable than a clean continuation. Any bounce is likely to face resistance at the SMA200D, then the EMA 21.
POTENTIAL SCENARIOS
- Scenario 1: Bullish Oversold Relief Bounce — Price holds the $80–85 support zone (the July low area), RSI recovers above 40 and CMF turns positive, and price mean-reverts toward the SMA200D and the Bollinger mid-band area. Trigger: a daily close above $88 with RSI turning up. Target: $90.50, with an extension to $92.60 (SMA200D). Invalidation: a daily close below $80. (45% probability)
- Scenario 2: Bearish Trend Continuation — The strong ADX/−DI trend persists. Any bounce fails at $92–95, and price breaks the July lows. MACD keeps diverging lower. Trigger: a close below $82 on rising volume. Target: $76–78, with a measured-move extension to about $72. Invalidation: a close above $95. (40% probability)
- Scenario 3: Neutral Basing Range — Price chops between roughly $80 and $93 as selling exhausts but buyers stay hesitant below the SMA200D. Trigger: repeated failures at $92 and holds at $82. Target: $85–89. Invalidation: a close outside $78–95. (15% probability)
PRICE TARGETS
- Target Price: $90.50 (34-day target)
- Expected Range: $78.00 to $93.50 (width $15.50 ≈ 18.2% of the current price, in line with the 30–60 day guidance)
- Key Levels: Support at $80.00 (recent wick low / July swing-low zone), Resistance at $92.59 (SMA200D, with the $99.53 EMA 21 above it)
OVERALL BIAS
OVERALL BIAS: BULLISH - Price is at an oversold extreme (RSI 29.3) on the lower Bollinger Band near the July swing-low support, with CMF improving and a long-wick capitulation-style candle, which favors a relief bounce toward the $92.59 SMA200D. The bullish call has only modest conviction: the trend is firmly bearish (ADX 26 with −DI 38 vs +DI 13, MACD widening), so a close below $80 would invalidate it.
This is educational analysis and not financial advice.