DELL 34-day bearish forecast — Nov 1, 2026
- Bias: Bearish
- Timeframe: 34 days (made Nov 1, 2026, target date Dec 4, 2026)
- Price at analysis: $424.30
- Price target: $400.00
- Expected range: $367.00 – $438.00
- Result: Pending — graded after the close on Dec 4, 2026
Get a free AI analysis of DELL today
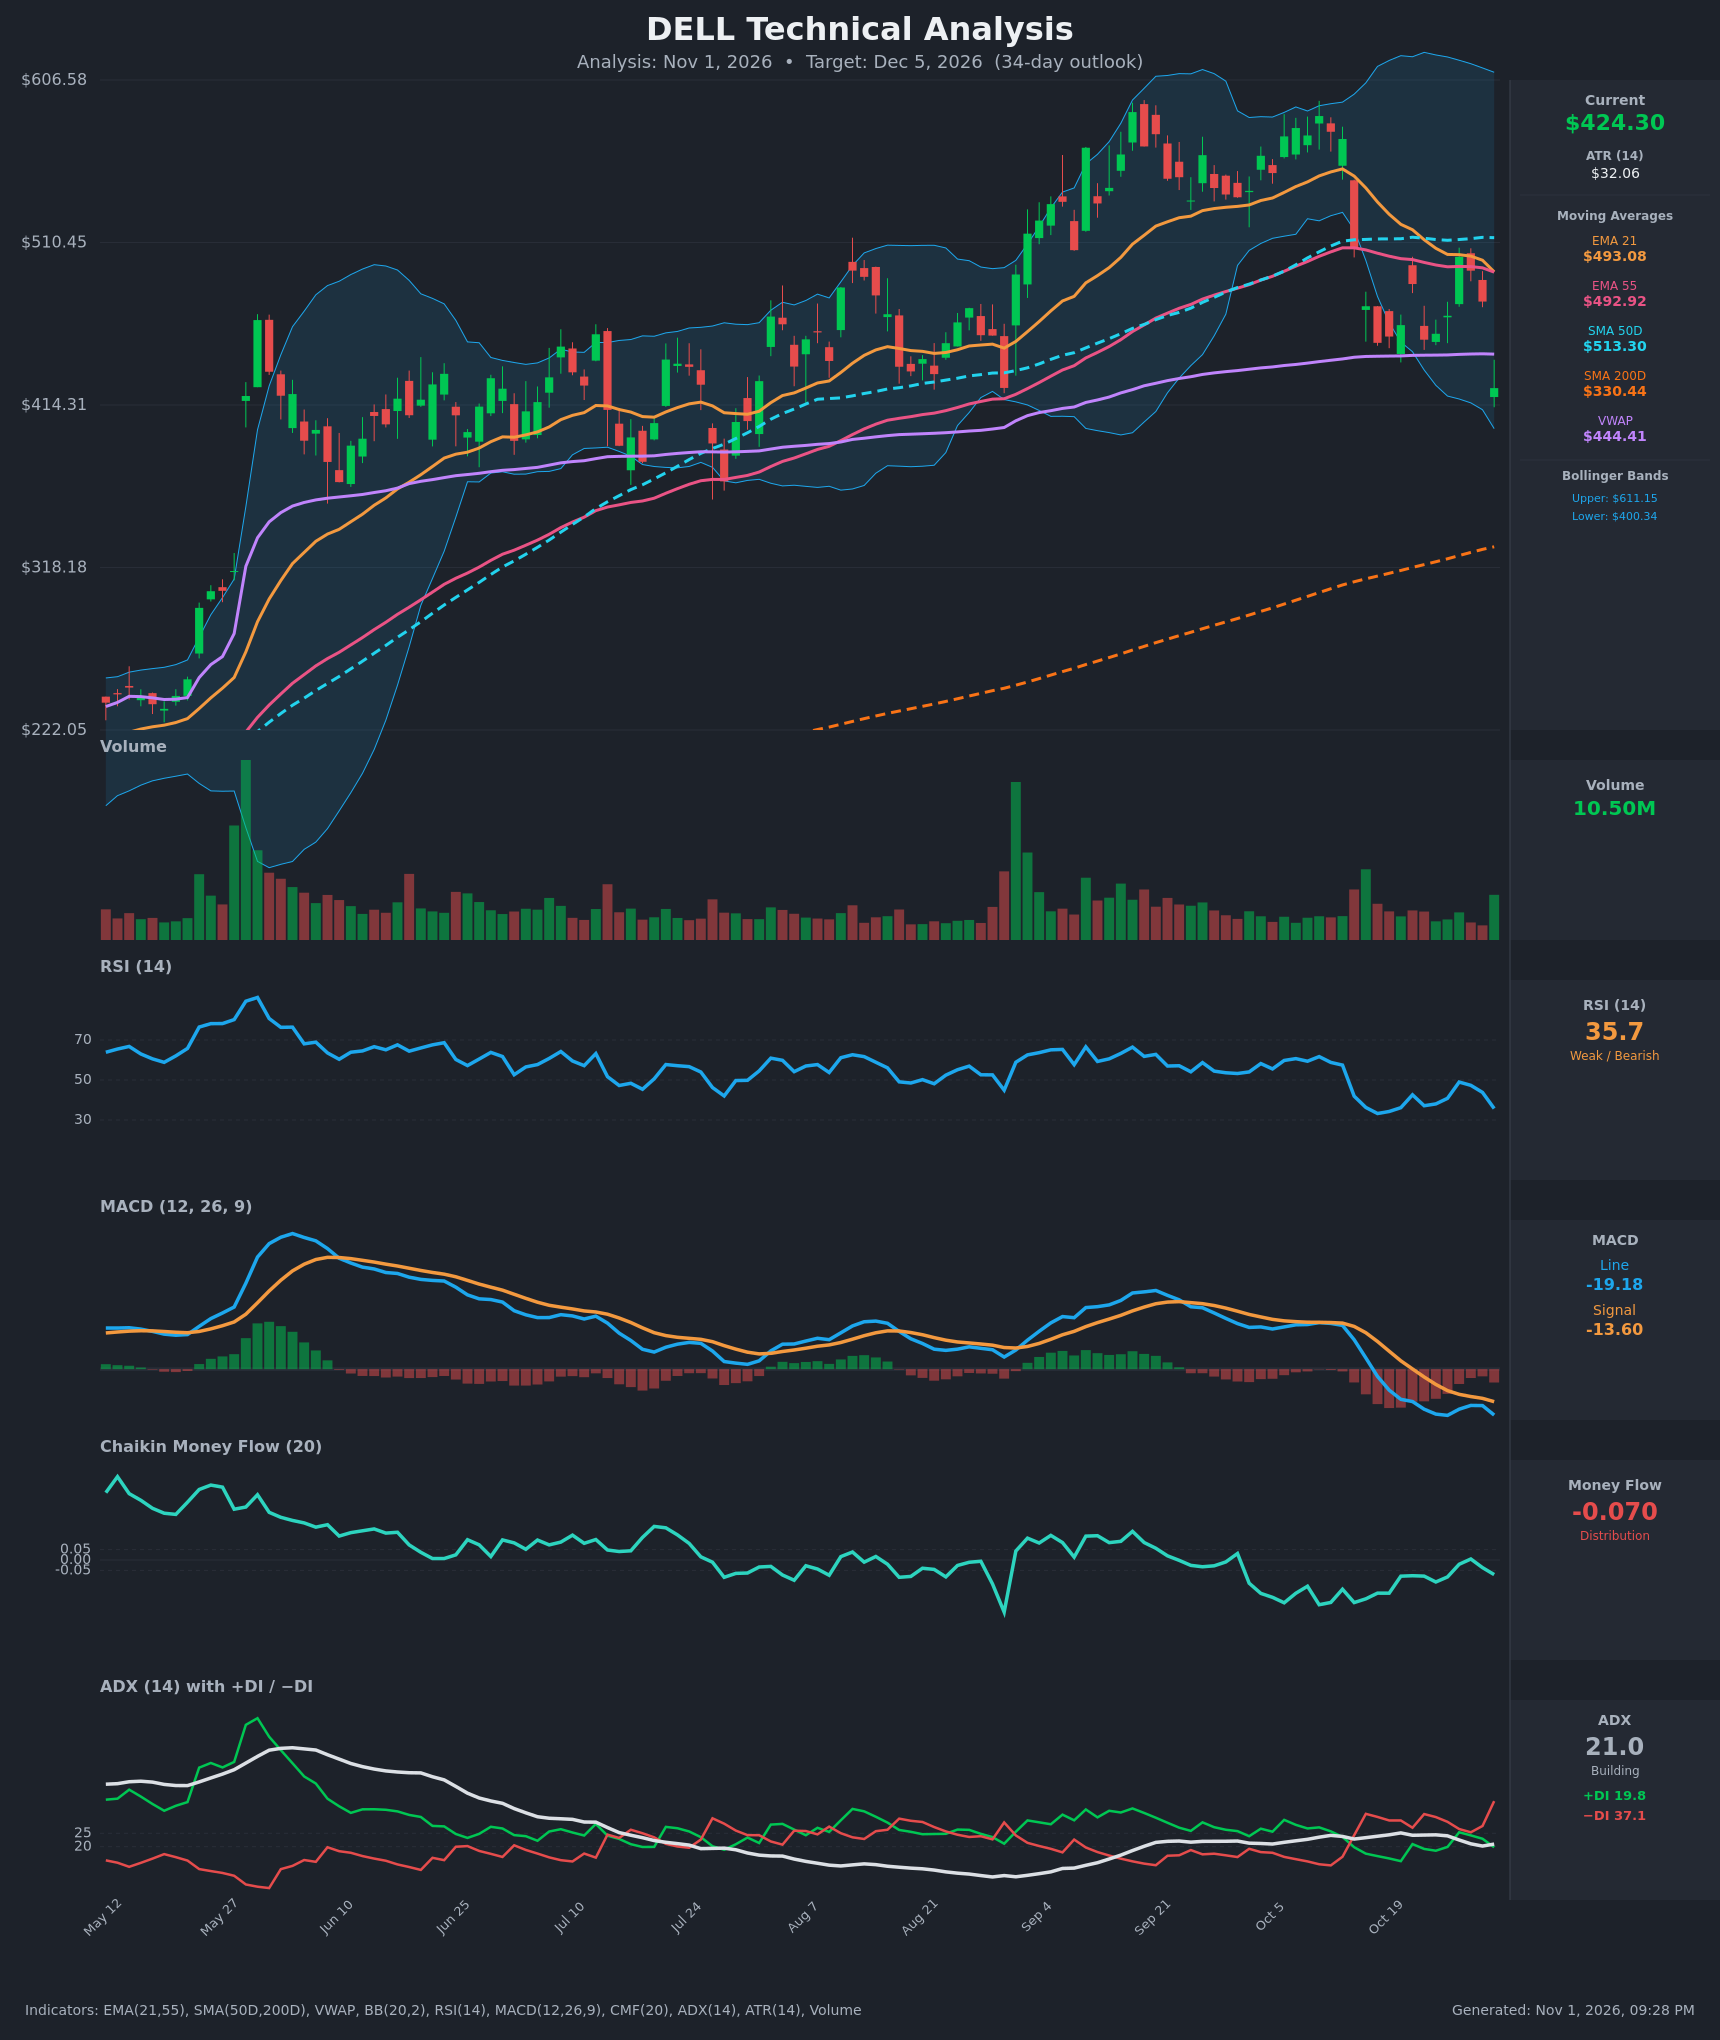
Analysis
TECHNICAL INDICATORS
- RSI (14): 35.74, down from 49 on Oct 27 and approaching oversold (<30) but not there yet. The Oct 16 low of 33.2 shows momentum bounces have been brief. Direction is down. [Bearish]
- 20 EMA: The 21 EMA is at $493.08 and price at $424.30 is about 14% below it. The EMA is falling and acts as overhead resistance. EMA21 ($493.08) has just crossed down to the EMA55 ($492.92), a fresh bearish crossover. [Bearish]
- MACD: Line -19.18 is below signal -13.60, with a bearish cross on Oct 16 (the line fell below zero and the signal followed on Oct 21). The histogram is negative and widening again after the Oct 30 drop, so downside momentum is accelerating. [Bearish]
- Bollinger Bands (20): Upper $611.15, lower $400.34, with the bands still wide after the earlier rally. Price is in the lower quarter of the bands, about $24 above the lower band. A close near the lower band signals a strong downtrend, but also raises the odds of a relief bounce. [Bearish]
- CMF (20): -0.070 is below the -0.05 threshold, so there is mild distribution. It has been negative for most of the period, with only a brief flirtation with zero on Oct 28 (+0.005). [Distribution]
- ADX (14): 21.0 and slightly rising, with −DI (37.1) far above +DI (19.8). The trend is still developing, not yet strong (>25), but the directional bias is clearly with the bears. [Weak but Building Trend – Bearish]
- Volume: 10.50M, above the recent average. The last bar looks like a bounce attempt on higher volume, but the Oct 14-15 breakdown also came on heavy volume. Selling pressure has been dominant, and the latest volume suggests a possible capitulation or at least a bounce attempt. [Mixed – leaning Bearish]
DIVERGENCES & TRENDS
- There is no clear bullish RSI divergence. RSI at 35.7 is above the Oct 16 low (33.2) while price ($424) is well below the Oct 16 close ($451), which would be a potential bullish divergence. However, RSI only made that higher reading after the latest drop and has not yet confirmed with a turn up, so it is tentative.
- MACD made a fresh lower low (-19.18 vs. -19.31 earlier, roughly equal), so momentum is confirming price weakness.
- Trend structure:
- The 21 EMA has crossed below the 55 EMA.
- Price is below the 21 EMA, 55 EMA, 50D SMA and VWAP ($444.41).
- The 50D SMA ($513.30) is still above the 200D SMA ($330.44), so there is no death cross, and price remains well above the 200D SMA (long-term uptrend intact).
- Lower highs since Oct 27 ($501.96 → $493.79 → $475.51) show the bounce failing at the EMAs.
- The Oct 30 close at $424.30 is the lowest in many weeks. It breaks the $450 area that held on Oct 16-22 and takes price back to the June-August consolidation range.
CHART PATTERNS
- Bearish Double Top (approximate): Highs near $590-600 in September and early October, with a break of the neckline around $500-510 on Oct 14. The measured move (about $90-100 of height) projects to roughly $400-410, close to the lower Bollinger Band at $400.34.
- Bearish Pennant/Flag (potential): The Oct 21-29 bounce with lower highs between $486-$502 looks like a small bearish flag or pennant, and the break below $450 was its resolution. The target is a continuation toward $400 and below.
- There is no valid bullish reversal pattern yet. A Bullish Double Bottom would need a bounce and a retest of $400-$415 that holds.
POTENTIAL SCENARIOS
- Scenario 1: Bearish Continuation to Lower Band — Price fails at VWAP/$445-$455, retests and slightly breaks the $400 area as −DI stays dominant and MACD keeps falling. Trigger: close below $410 with CMF staying negative. Target: $385-$400 first, with an extension to $370. Invalidation: daily close above $455-$460 (above VWAP and the Oct 21/Oct 29 highs). (50% probability)
- Scenario 2: Bullish Oversold Relief Bounce — RSI turns up from the mid-30s, the stock holds the $400-$415 prior range and squeezes toward VWAP and the broken support zone. Trigger: close above $445 on strong volume. Target: $455-$475 (below the 21/55 EMAs at ~$493 where sellers should reappear). Invalidation: close below $400. (33% probability)
- Scenario 3: Neutral Consolidation — Price chops between $400 and $450 as ADX stays near 20 and the sell-off pauses. Trigger: repeated holds of $400 and rejections at $445. Target: $410-$440. Invalidation: a decisive close outside the $400-$450 range. (17% probability)
PRICE TARGETS
- Target Price: $400.00 (34-day)
- Expected Range: $367.00 to $438.00 (width $71, about 16.7% of current price, which fits the 30-60 day guidance of 12-18%)
- Key Levels: Support at $400.34 (lower Bollinger Band; below that, $330.44 at the 200D SMA), Resistance at $444.41 (VWAP; then the EMA cluster at ~$493)
OVERALL BIAS
OVERALL BIAS: BEARISH - Price has broken down through the EMAs and 50D SMA with a bearish MACD cross, −DI (37.1) far above +DI (19.8), and CMF in distribution. The double-top measured move points to about $400, though the oversold RSI argues for a possible bounce first.
This is educational analysis and not financial advice.