NFLX 34-day bearish forecast — Nov 1, 2026
- Bias: Bearish
- Timeframe: 34 days (made Nov 1, 2026, target date Dec 4, 2026)
- Price at analysis: $62.08
- Price target: $60.00
- Expected range: $55.00 – $65.50
- Result: Pending — graded after the close on Dec 4, 2026
Get a free AI analysis of NFLX today
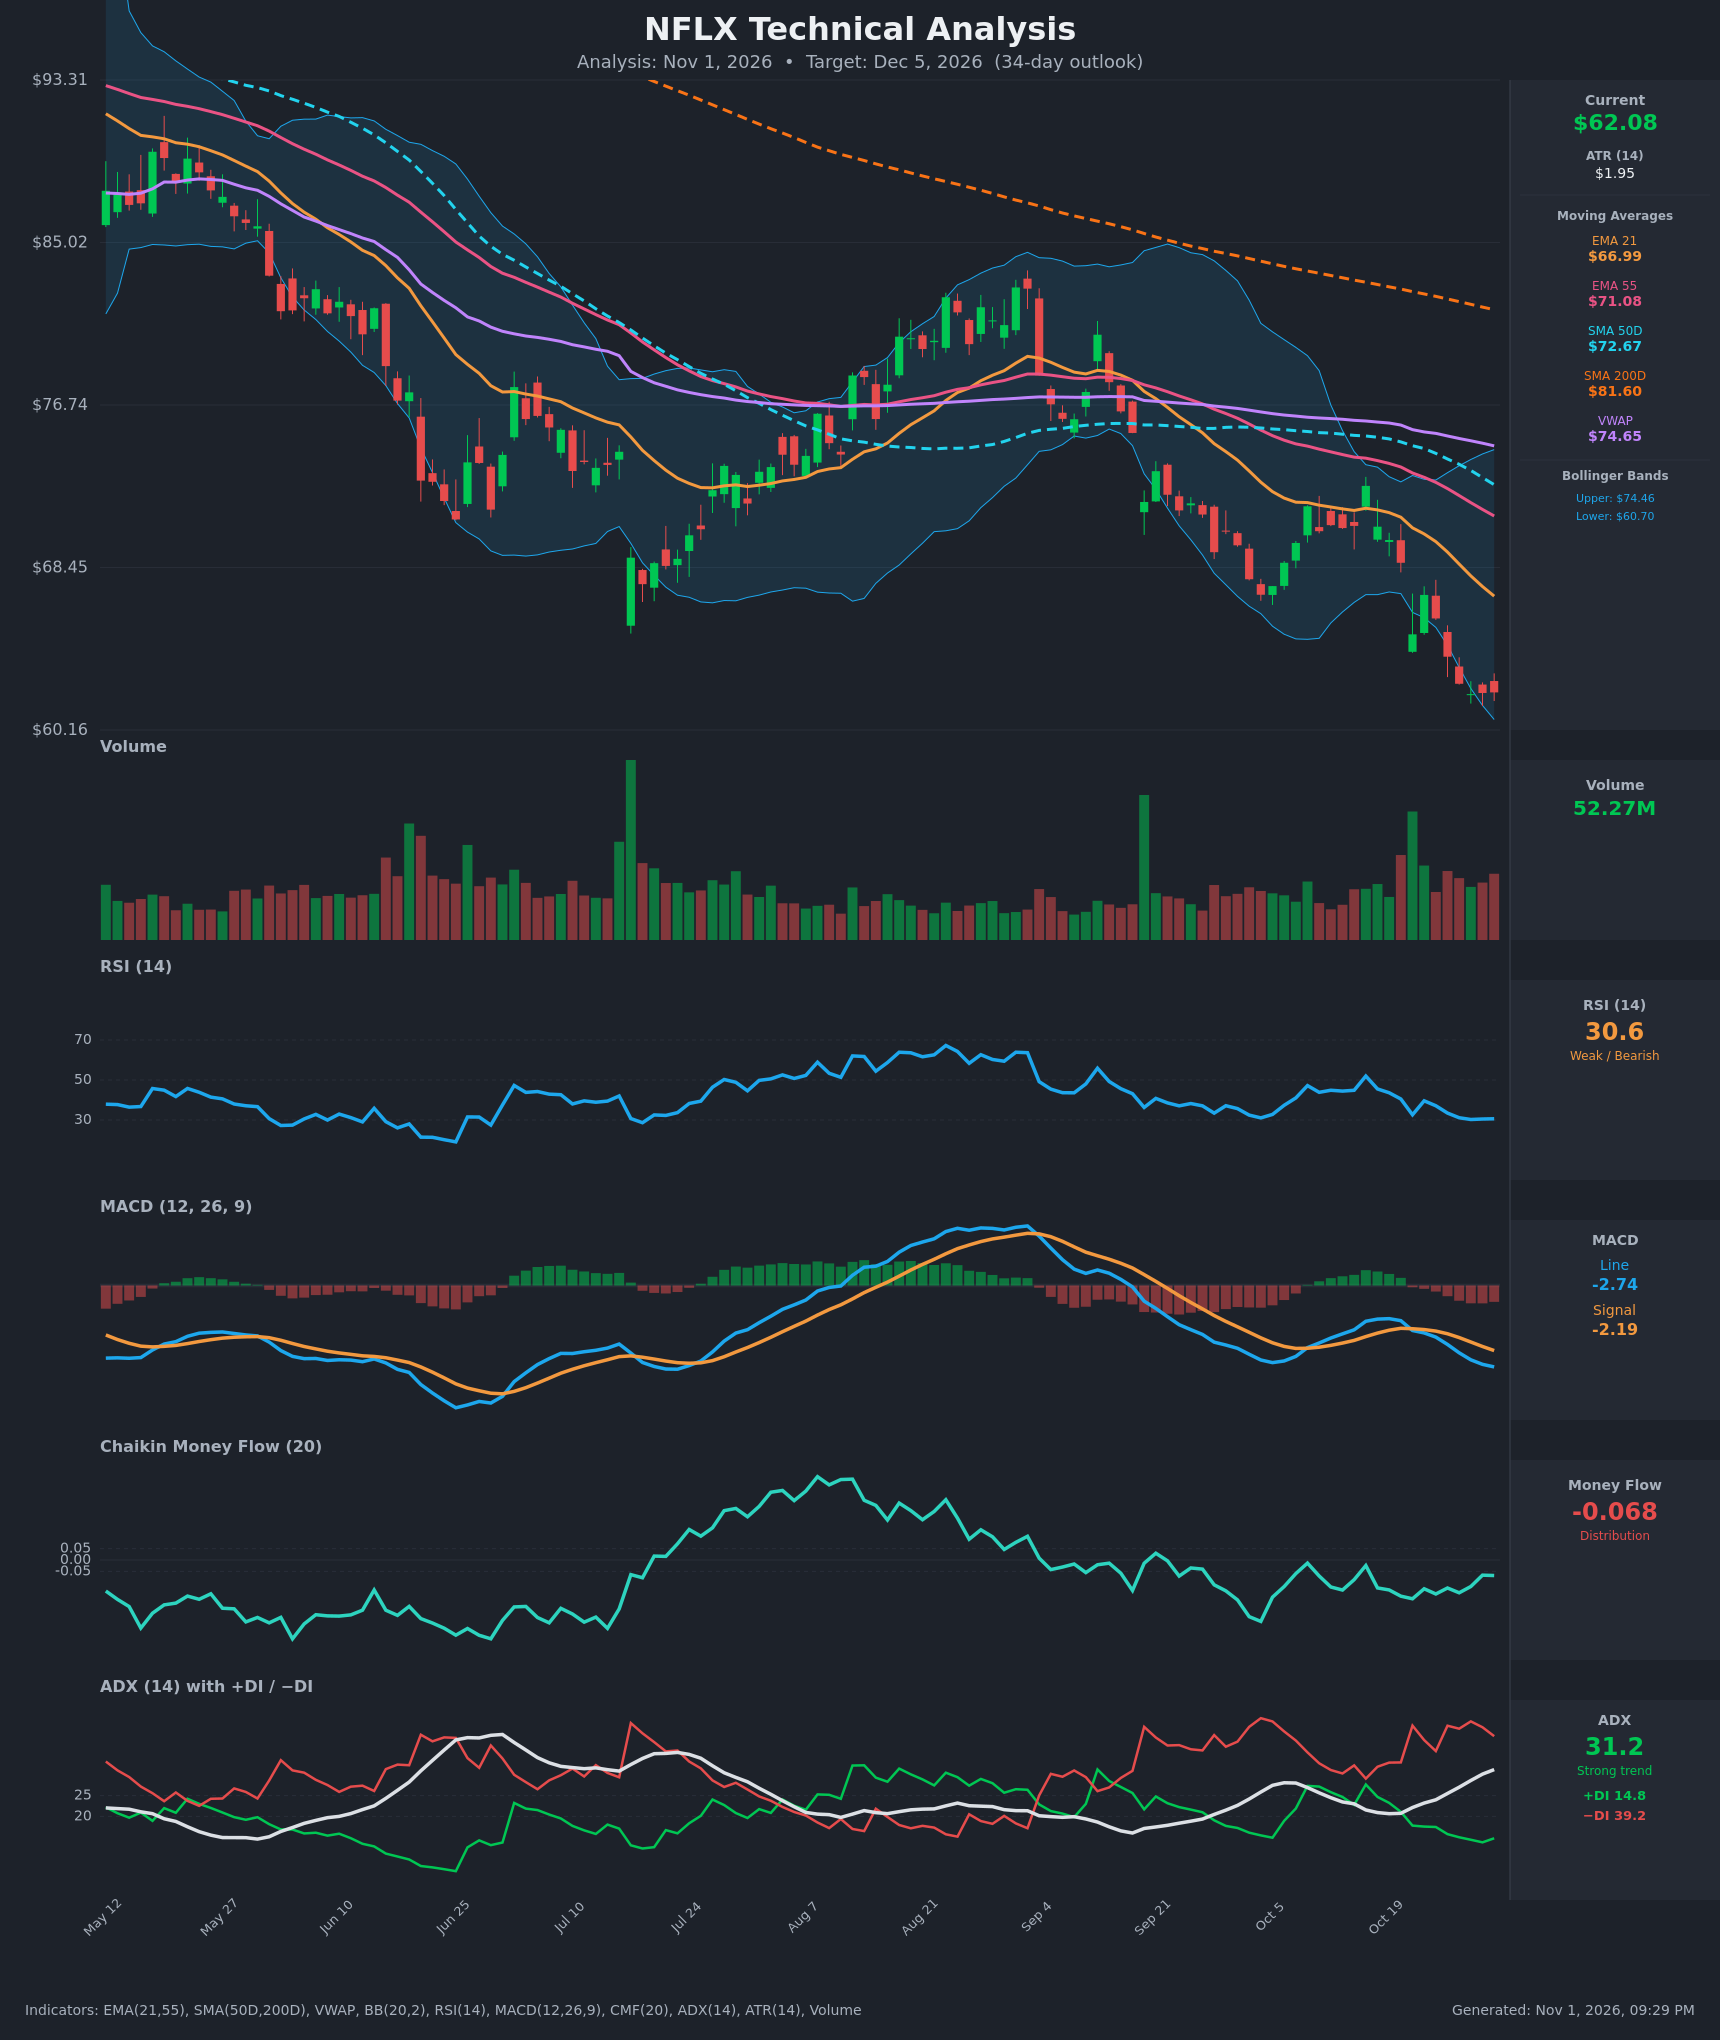
Analysis
TECHNICAL INDICATORS
- RSI (14): 30.62, sitting at the oversold threshold after dropping from 52 on Oct 15. It has flattened at 30-31 for the last four bars, so downside momentum is stalling but no bullish reversal has appeared. In a strong downtrend, RSI can stay pinned near 30. [Bearish]
- 20 EMA (EMA 21): $66.99, with price at $62.08, about 7.3% below it. The EMA is sloping down steeply and is acting as overhead resistance. EMA 21 is also below EMA 55 ($71.08), which confirms the bearish stack. [Bearish]
- MACD: Line -2.738 is below signal -2.189, a bearish crossover that happened around Oct 21. The histogram is negative (about -0.55) and has widened for several sessions, so bearish momentum is still building. [Bearish]
- Bollinger Bands (20): Upper $74.46, lower $60.70. Price at $62.08 is in the lower band, about 10% of the band width above the lower band. The bands are expanding downward, and the price walked the lower band through late October. This shows a trend with a strong downside push, but it also leaves price stretched for a relief bounce. [Bearish]
- CMF (20): -0.068, below the -0.05 threshold. It has been negative for the whole window, though it has improved slightly from -0.17 on Oct 21, which hints at easing selling pressure. [Distribution]
- ADX (14): 31.2 and rising, up from 20.7 on Oct 19, so this is a strong trend. −DI (39.2) is far above +DI (14.8), so sellers are firmly in control. [Strong Trend – Bearish]
- Volume: 52.27M on the latest bar, elevated compared with the quieter mid-year sessions. Heavy volume on the breakdown below $65 confirms the selling is committed, though it also hints at possible capitulation. [Bearish with capitulation risk]
DIVERGENCES & TRENDS
- Divergence: No bullish RSI divergence yet. The RSI low of about 30 is in line with price making new lows. There is a small improvement in CMF (-0.17 to -0.07) while price made new lows, but it is not yet a clear divergence.
- Moving average structure: Price ($62.08) < EMA21 ($66.99) < EMA55 ($71.08) < SMA50D ($72.67) < VWAP ($74.65) < SMA200D ($81.60). This is a fully bearish stack. The SMA50D is already below the SMA200D (death cross in place), and both are falling.
- MACD: The bearish crossover is intact, and both lines are moving further below zero.
- ADX/DI: −DI crossed above +DI and the gap is widening, with ADX rising through 25 to 31. That is a classic trend-acceleration signal.
- Price action: The stock peaked near $83 in late August and has made lower highs and lower lows since. It is now breaking below the June low area (about $65).
CHART PATTERNS
- Primary pattern: Price is in a prolonged downtrend that looks like a Bearish Rising Wedge or Descending Triangle-type continuation structure from the reference diagram. It is not a clean match. The cleaner read is a bearish continuation after the Sep–Oct lower highs, with a break below the prior $65 support.
- Possible bullish reversal watch: A Bullish Falling Wedge could form if the decline slows, but price has not broken above any wedge resistance.
- Significance: The prior consolidation range was roughly $65 to $72 in October. Its height of about $7 projected from the break near $65 gives a measured target near $58.
- Targets: The measured move is about $58. A bounce toward the EMA21 near $67 is plausible before any continuation.
POTENTIAL SCENARIOS
- Scenario 1: Bearish Trend Continuation — The strong ADX, widening −DI gap, negative MACD, and the stacked moving averages favor further downside. Rallies fade at the declining EMA21. Trigger: daily close below $60.70 (the lower Bollinger Band). Target: $56-$58. Invalidation: close above $67 (EMA21). (45% probability)
- Scenario 2: Bullish Oversold Relief Bounce — RSI at 30 and the lower band tag, along with a rebound in CMF, set up a mean-reversion bounce that stays below the falling averages. Trigger: a hold above $60 plus a close above $64. Target: $66-$68 (EMA21). Invalidation: close below $59.50. (35% probability)
- Scenario 3: Neutral Basing Range — Price stabilizes after capitulation volume and chops sideways. Trigger: a series of closes between $59 and $65 with ADX turning down. Target: $60-$65. Invalidation: a decisive break outside that range. (20% probability)
PRICE TARGETS
For the 34-day timeframe, the range width should be about 12-18% of the current price. The Expected Range is $55.00 to $65.50, a width of $10.50, or 16.9% of $62.08, which fits the guidance.
- Target Price: $60.00
- Expected Range: $55.00 to $65.50
- Key Levels: Support at $60.70, Resistance at $66.99
OVERALL BIAS
OVERALL BIAS: BEARISH - A strong, rising ADX with −DI far above +DI, a bearish MACD crossover, a fully bearish moving average stack including a death cross, and persistent distribution favor more downside. The oversold RSI and the lower band tag make a bounce likely along the way, but rallies should be capped near the EMA21 at about $67.
This is educational analysis and not financial advice.