NBIS 34-day bearish forecast — Nov 1, 2026
- Bias: Bearish
- Timeframe: 34 days (made Nov 1, 2026, target date Dec 4, 2026)
- Price at analysis: $154.14
- Price target: $143.00
- Expected range: $118.00 – $170.00
- Result: Pending — graded after the close on Dec 4, 2026
Get a free AI analysis of NBIS today
Analysis
TECHNICAL INDICATORS
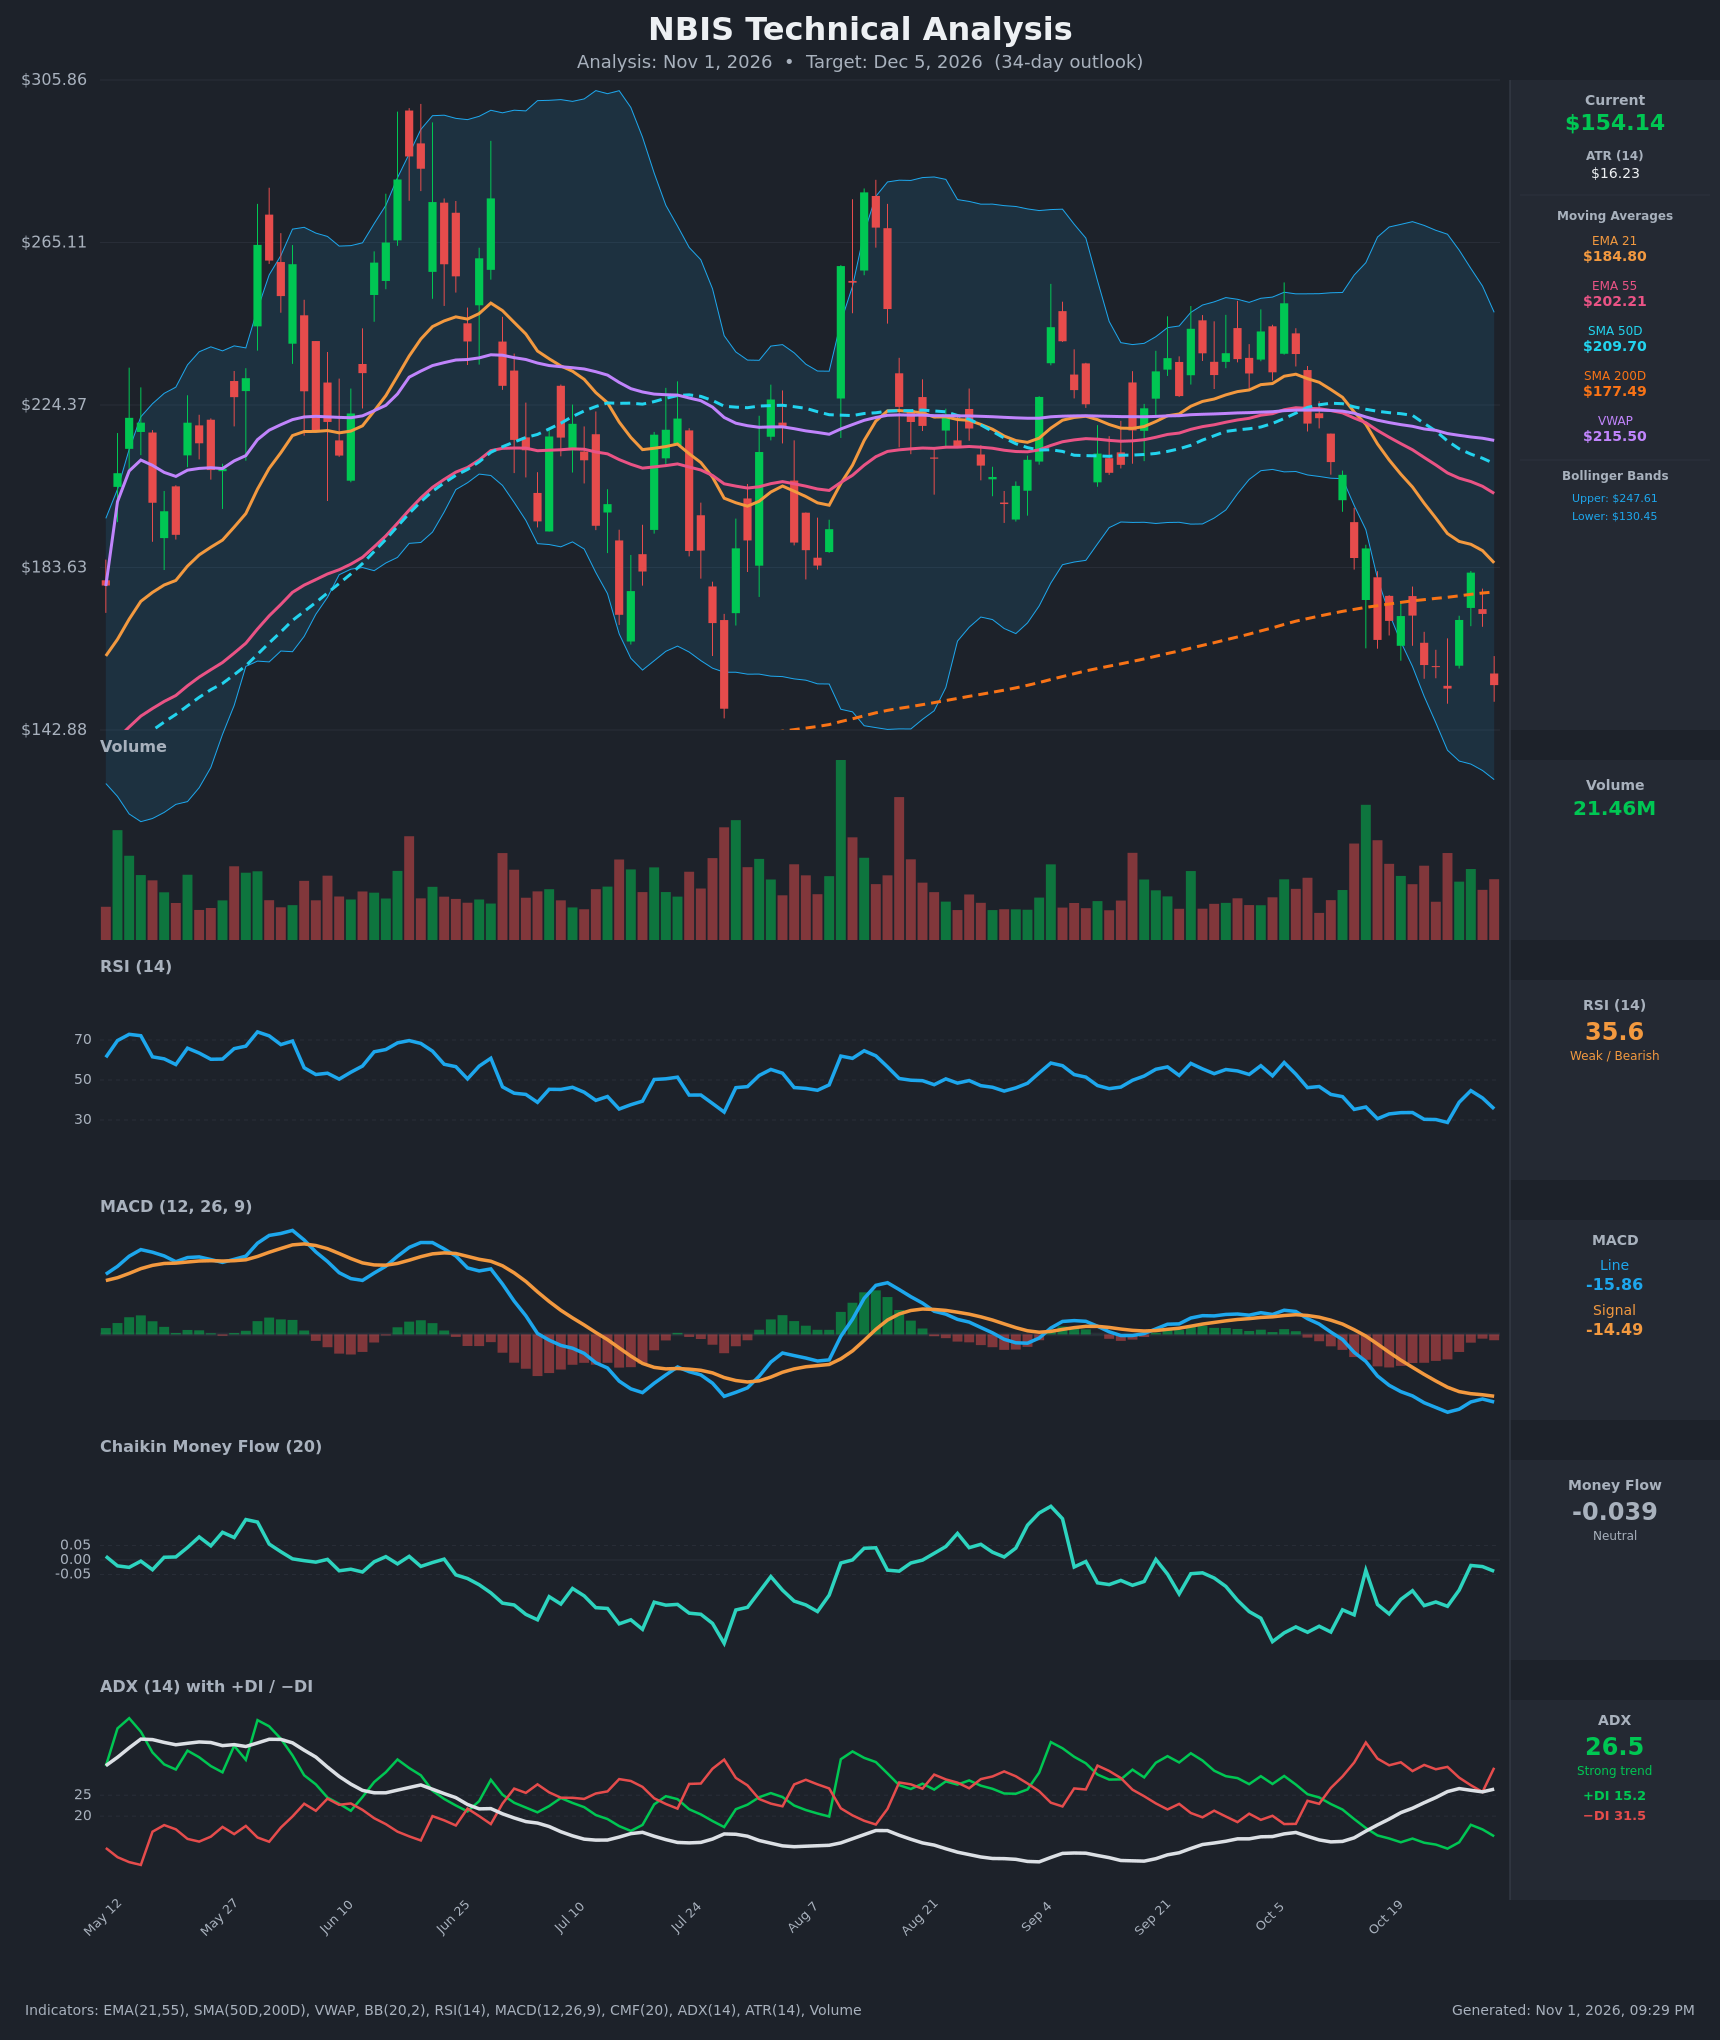
- RSI (14): 35.58. It is near oversold but not there yet. It bounced from 28.8 on Oct 26 to 44.7 on Oct 28, then rolled over to 35.6, a lower high that shows sellers still control rallies. [Bearish]
- 20 EMA: The 21 EMA is $184.80 and price at $154.14 is about 17% below it. The EMA is falling steeply (from $228 on Oct 12) and acts as overhead resistance. EMA21 is also below EMA55 ($202.21), a bearish alignment. [Bearish]
- MACD: The MACD line is -15.86 and the signal is -14.49, so the line is back below the signal after a brief near-cross on Oct 28. The histogram is negative again (about -1.4). Momentum is deeply negative, with only a slight loss of downside speed relative to the Oct 26 low (-18.2). [Bearish]
- Bollinger Bands (20): The upper band is $247.61, the lower is $130.45, and the midline is about $189. Price is in the lower third of the bands, about $23.70 above the lower band. The bands are wide, so volatility is elevated. There is no walk on the lower band, and the Oct 26 low of $153.27 was retested today. [Bearish]
- CMF (20): -0.039 sits in the neutral zone (between -0.05 and +0.05). It improved from -0.25 on Oct 12 to near zero, so selling pressure has eased. It has not turned into accumulation. [Neutral]
- ADX (14): 26.5 and rising, with −DI (31.5) well above +DI (15.2). This is a strong, established downtrend with bears in control. [Strong Trend – Bearish]
- Volume: 21.46M, which is moderate and not a capitulation spike. Recent selling days carried decent volume, and bounces were on lighter volume. [Mildly Bearish]
DIVERGENCES & TRENDS
- Price retested the Oct 26 low ($153.27) with a close of $154.14. RSI is at 35.6 versus 28.8 then, so there is a mild bullish RSI divergence. It is not confirmed and is undermined by the lower RSI high on Oct 28.
- The CMF improvement from -0.25 to about -0.04 while price fell is a slight bullish divergence in money flow, but it is still neutral.
- Price is below EMA21, EMA55, SMA50D ($209.70) and VWAP ($215.50), so every short- and medium-term average is resistance.
- The SMA50D is falling toward the SMA200D ($177.49). A death cross is likely within weeks if the decline continues.
- Price is below the SMA200D ($177.49) for the first time in this window. It broke that long-term support in mid-October and failed to hold the bounce to $182.
- The MACD bearish crossover happened Oct 13-15, and the line is back below the signal after the Oct 28 bounce.
- The EMA21/EMA55 bearish crossover occurred around Oct 15.
- The −DI/+DI bearish control has persisted since early October.
CHART PATTERNS
- Bearish Head and Shoulders / lower-high structure: Price peaked near $295 in June, made a lower high around $270 in August, and another lower high around $250 in October. That is a series of lower highs followed by a break of the $165–$175 area.
- Bearish continuation / flag: The Oct 27-28 bounce to about $182, followed by a rejection under the 200D SMA and EMA21, resembles a small bearish flag or pennant. The measured move from the October drop (about $210 to $153, or roughly $57) suggests downside toward $130 if the Oct 26 low ($153) breaks.
- The $130 area also lines up with the lower Bollinger Band ($130.45) and the June-July low zone, making it a logical target.
- A bullish double-bottom around $153 is possible but would need a close above $182 to confirm.
POTENTIAL SCENARIOS
- Scenario 1: Bearish Breakdown Continuation — Price loses the $153 support (Oct 26 low), the trend is strong (ADX 26.5, −DI dominant) and the MACD stays negative. Trigger: a daily close below $153 on rising volume. Target: $130–$135 (lower Bollinger Band and measured move), with an extension toward $122. Invalidation: a daily close above $182 (the 200D SMA and last bounce high). (50% probability)
- Scenario 2: Neutral Range-Bound Base — Price consolidates between about $140 and $175 as RSI holds around 30-40 and CMF stays near zero. Trigger: holding $145-$150 for several sessions. Target: $150-$165 oscillation. Invalidation: a close below $140 or above $185. (20% probability)
- Scenario 3: Bullish Oversold Relief Rally — A double bottom at $153 combined with the RSI divergence and improving CMF sparks a bounce. Trigger: a close above $172 with volume. Target: $182-$185 (SMA200D and EMA21), then $200. Invalidation: a close below $150. (30% probability)
PRICE TARGETS
- Target Price: $143.00 (34-day)
- Expected Range: $118.00 to $170.00 (width $52, about 33.7% of price). This is wide because the ATR is high (about $16), and a 34-day horizon at this ATR can easily span 1.5-2 ATRs either way. It is above the 12-18% guide because the stock's volatility is far above average, so I widened it deliberately.
- Key Levels: Support at $130.45 (lower Bollinger Band and measured-move zone), Resistance at $177.49 (SMA200D)
OVERALL BIAS
OVERALL BIAS: BEARISH - The stock is in a strong downtrend (ADX 26.5, −DI 31.5 vs +DI 15.2), trades below every key moving average including the 200D SMA, and MACD and RSI remain weak. Mild divergences and neutral CMF argue for a possible relief bounce, but the path of least resistance is toward the $130 area.
This is educational analysis and not financial advice.