AAPL 34-day bullish forecast — Nov 1, 2026
- Bias: Bullish
- Timeframe: 34 days (made Nov 1, 2026, target date Dec 4, 2026)
- Price at analysis: $344.63
- Price target: $352.00
- Expected range: $324.00 – $374.00
- Result: Pending — graded after the close on Dec 4, 2026
Get a free AI analysis of AAPL today
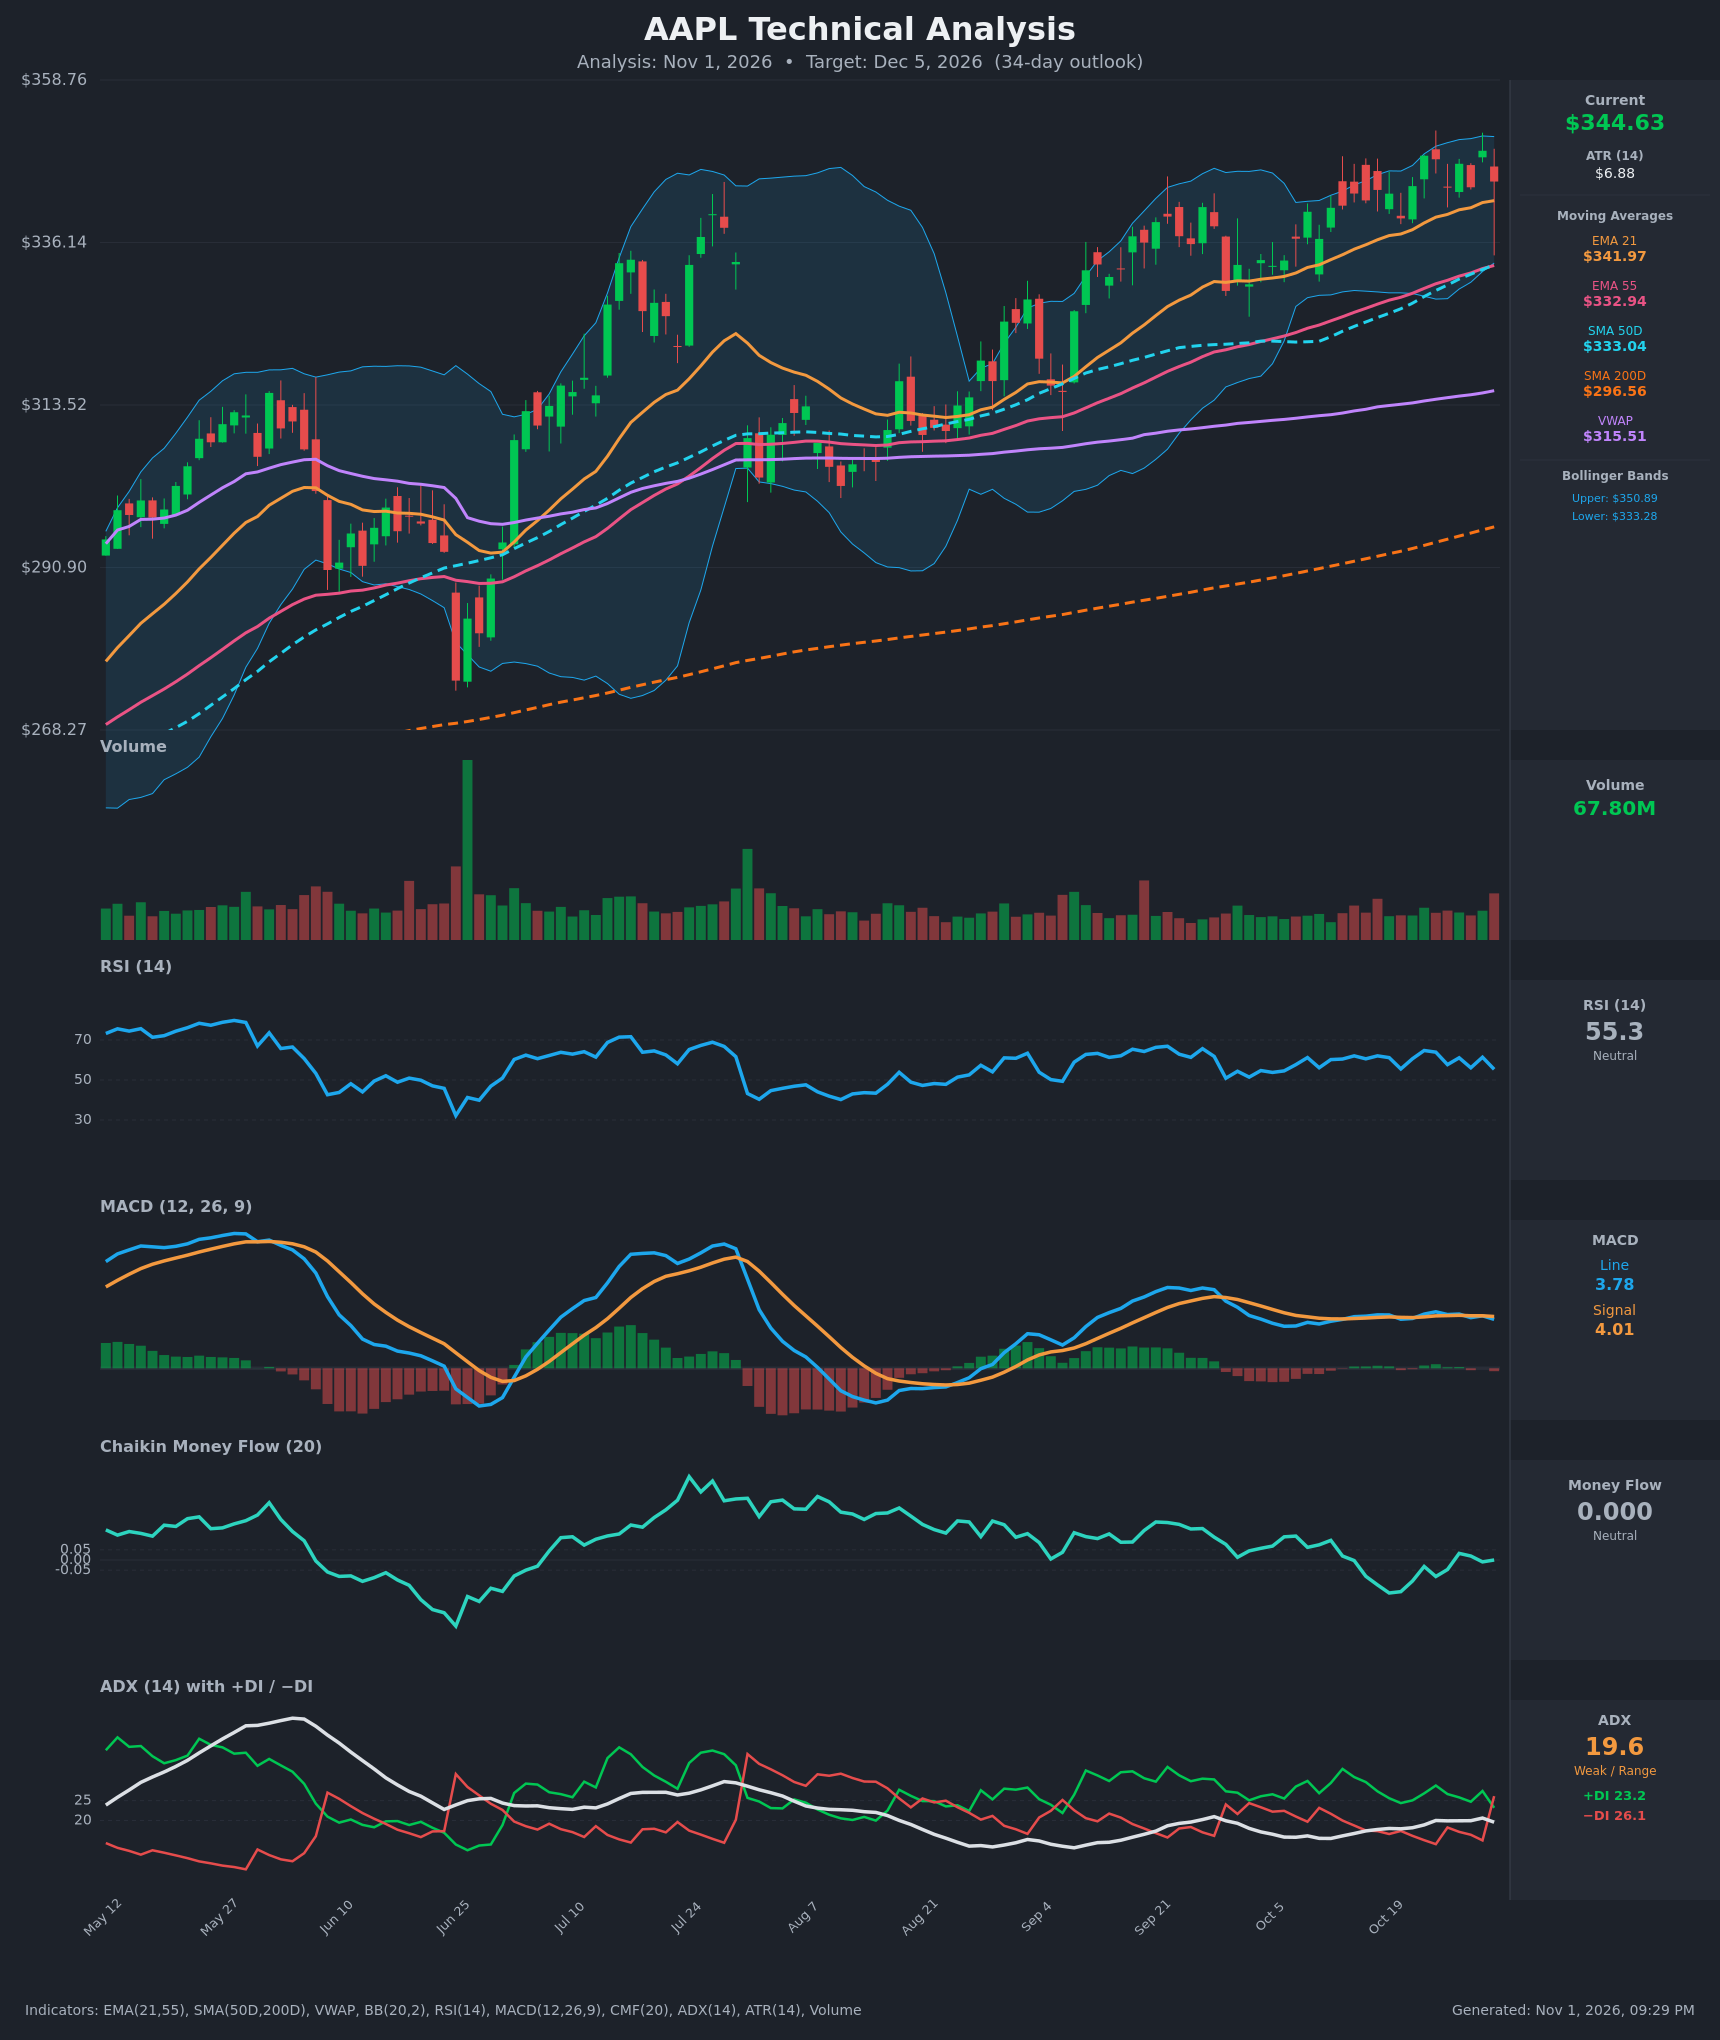
Analysis
TECHNICAL INDICATORS
- RSI (14): 55.35, in neutral territory and down from 61.4 the prior day. It has held between ~55 and 65 for three weeks, so momentum is steady but not strengthening. [Neutral]
- 20 EMA (EMA 21 = $341.97): Price at $344.63 is above it, and the EMA is rising (about $333.75 on Oct 12). Dips toward $340-342 have been bought repeatedly. [Bullish]
- MACD: Line 3.78 is below signal 4.006, a fresh bearish crossover on the last bar. Both lines are flat near 4 and the histogram is marginally negative. Momentum has stalled since mid-October rather than collapsed. [Bearish]
- Bollinger Bands (20): Upper $350.89, lower $333.28, midline about $342.08. Price is in the upper half, below the upper band, after being rejected near $349. The bands are fairly narrow, which points to consolidation. [Neutral]
- CMF (20): 0.000, inside the ±0.05 neutral zone. It has drifted from +0.097 on Oct 12 to slightly negative, and now back to flat, so there is no clear accumulation. [Neutral]
- ADX (14): 19.6, a weak, range-bound trend. −DI (26.1) just crossed above +DI (23.2), reversing a bullish stance that held all month. With ADX under 20, the cross is a caution flag rather than a trend signal. [Weak Trend, slightly bearish]
- Volume: 67.80M on the last bar, above recent average volume, on a red candle with a long lower wick. That suggests some distribution at the highs, but the wick shows dip buyers stepped in. [Mixed, slightly bearish]
DIVERGENCES & TRENDS
- Long-term structure: Price is above SMA200D ($296.56), SMA50D ($333.04), EMA55 ($332.94) and EMA21 ($341.97). The stack is fully bullish, with EMA21 > EMA55 and SMA50D well above SMA200D. The golden cross is long established.
- Mild bearish divergence: Price made a higher high at $348.91 on Oct 29, but MACD (4.06 vs 4.37 on Oct 23) and RSI (61.4 vs 64.8 on Oct 22) did not confirm. CMF has also been flat to negative while price is near its highs.
- Recent crossovers: The MACD bearish cross and −DI > +DI cross both happened on the last bar or two. The EMA21/EMA55 gap is widening, so no EMA cross is near.
- Price is above VWAP ($315.51): This is a long-term bullish backdrop.
- Consolidation: The last 3 weeks have been confined to roughly $339-$349.
- Trend: The uptrend since the August low is intact (higher lows). Its pace has slowed, as the weak ADX shows.
CHART PATTERNS
- Rising channel / possible Bearish Double Top: Highs at $348.22 (Oct 22) and $348.91 (Oct 29) sit near a ~$349 ceiling, with a trough around $339.50. A double top confirms only on a close below ~$339.50. The measured move would be ~$10, giving ~$330, which coincides with the SMA50D/EMA55 cluster.
- Bullish continuation/flag-like consolidation: The tight sideways drift under the upper Bollinger Band after a strong advance resembles a Bullish Flag/Pennant. A breakout above ~$349 would project toward ~$360 (the prior leg of roughly $15-20 added to the breakout).
- Neither pattern has triggered yet. The trend context and rising moving averages favor the continuation reading, but the double-top neckline near $339.50 is the key trigger to watch.
POTENTIAL SCENARIOS
- Scenario 1: Bullish Range Breakout / Trend Continuation — Buyers defend the $340-342 EMA21 zone and price breaks the $349 ceiling, resuming the uptrend. Trigger: close above $349-351 on rising volume. Target: $352-$362. Invalidation: close below $339.50. (45% probability)
- Scenario 2: Bearish Double-Top Pullback — The MACD and DI crosses and the double top lead to a break of $339.50, with a retest of the $333 support cluster and possibly the lower $320s. Trigger: close below $339.50 with expanding volume. Target: $333, then $325. Invalidation: reclaim of $349. (30% probability)
- Scenario 3: Neutral Sideways Consolidation — Weak ADX keeps price oscillating between ~$335 and $350. Trigger: failure to break either side. Target: $340-$348. Invalidation: close outside $333-$351. (25% probability)
PRICE TARGETS
- Target Price: $352.00 (34-day horizon)
- Expected Range: $324.00 to $374.00 (width $50 ≈ 14.5% of current price, consistent with 30-60 day guidance of 12-18%)
- Key Levels: Support at $333.00 (SMA50D/EMA55/lower Bollinger Band), Resistance at $349.00 (recent double-top highs, upper Bollinger Band ~$350.89)
OVERALL BIAS
OVERALL BIAS: BULLISH - The long-term uptrend is intact, with price above every major moving average and the EMA21/EMA55/SMA stack aligned upward. The fresh MACD and DI bearish crosses with weak ADX argue for a choppy path, but the weight of evidence favors a drift above $349 over the 34 days. A close below $339.50 would weaken this view.
This is educational analysis and not financial advice.