AMZN 34-day bearish forecast — Nov 1, 2026
- Bias: Bearish
- Timeframe: 34 days (made Nov 1, 2026, target date Dec 4, 2026)
- Price at analysis: $240.35
- Price target: $235.50
- Expected range: $219.00 – $255.00
- Result: Pending — graded after the close on Dec 4, 2026
Get a free AI analysis of AMZN today
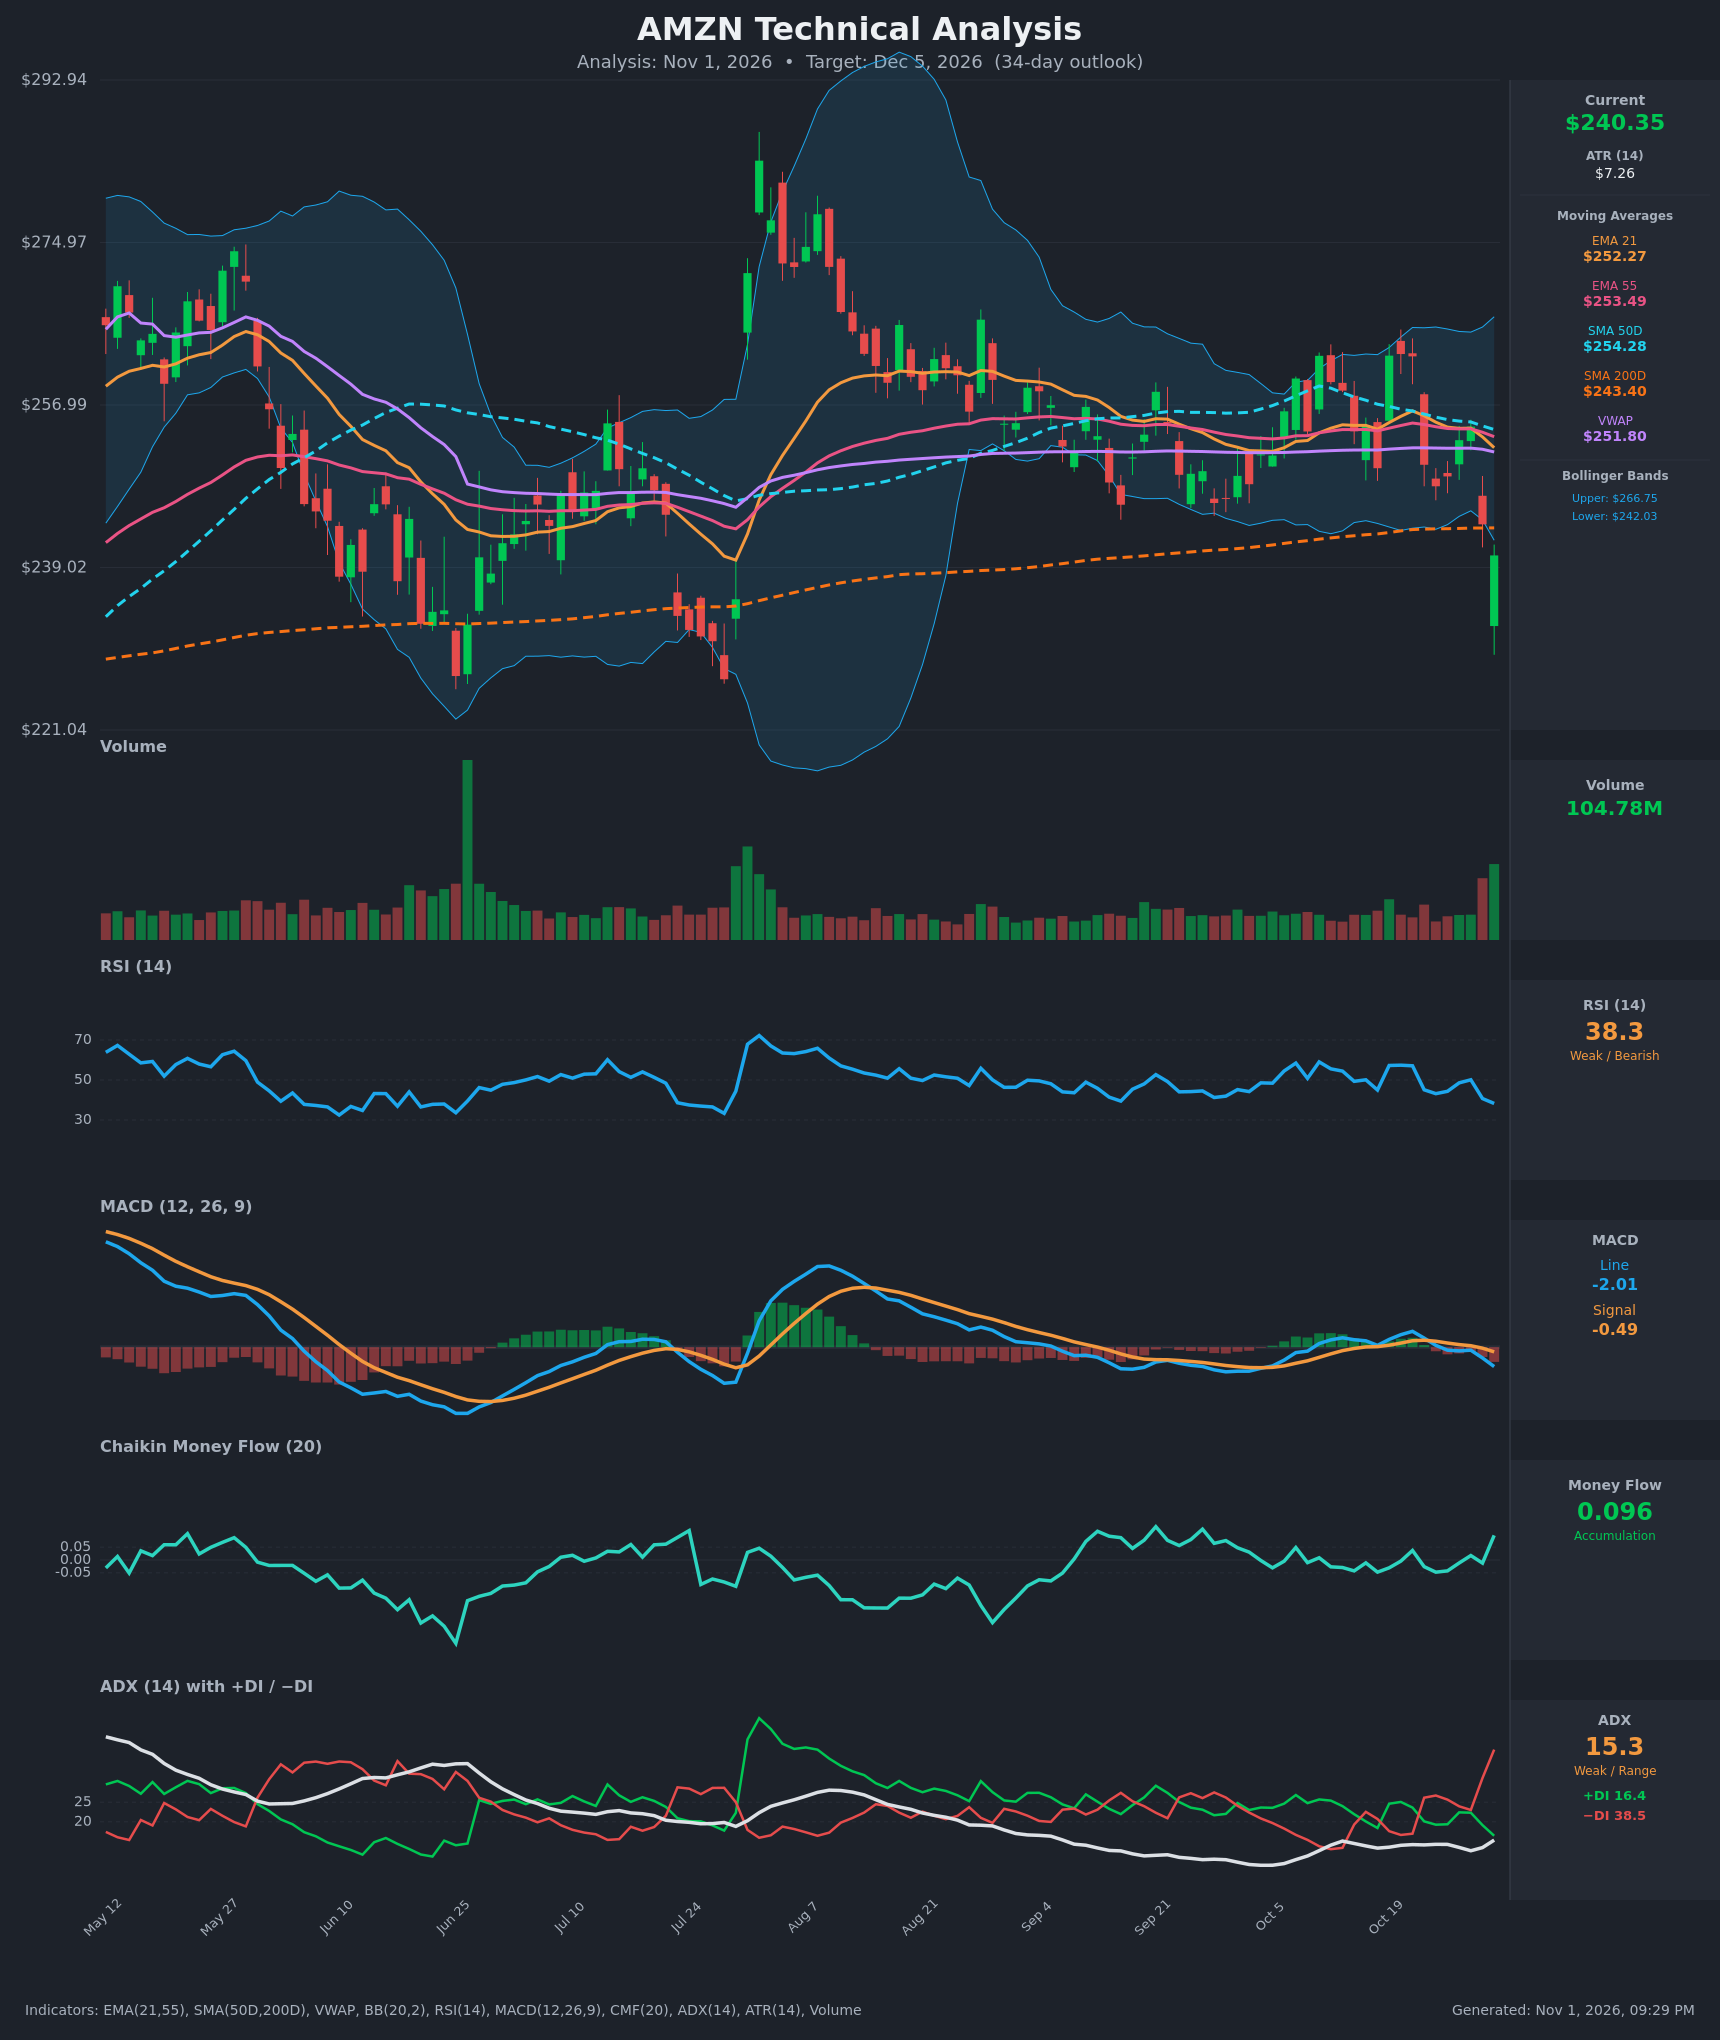
Analysis
TECHNICAL INDICATORS
- RSI (14): 38.26, down from 50 on Oct 28 and 57 on Oct 20-21. Momentum is falling and approaching oversold (30) but is not there yet. Lower highs on each bounce since Oct 21 favor sellers. [Bearish]
- 20 EMA (EMA 21 = $252.27): Price at $240.35 is about 4.7% below it, and the EMA is rolling over from $256.34 on Oct 21. EMA 21 ($252.27) is also below EMA 55 ($253.49), a fresh bearish crossover that occurred around Oct 29-30. The EMAs are overhead resistance. [Bearish]
- MACD: Line -2.01 is below signal -0.49, and the histogram is negative and widening. The bearish crossover happened around Oct 29 and both lines are now below zero. [Bearish]
- Bollinger Bands (20): Upper $266.75, lower $242.03. Price is below the lower band after a gap-down, a stretched reading. In a weak-ADX environment this can trigger a snapback toward the mid-band (~$254). A close below the band after a high-volume break can also start a "band walk" lower. The bands are fairly narrow, so volatility is moderate. [Neutral]
- CMF (20): +0.096, above the +0.05 threshold, and it jumped from -0.012 yesterday. Closes within bars are showing buying pressure on the washout, and some dip-buying is visible. It conflicts with the price action and is a single-day spike, so it carries less weight than the trend indicators. [Accumulation]
- ADX (14): 15.3 with −DI 38.5 well above +DI 16.4. The trend is weak (ADX below 20) but ADX has turned up from 12.6, and the DI spread has widened sharply in favor of bears (+DI/−DI crossed bearish Oct 22 and again Oct 29). Sellers have the direction, though not yet a mature trend. [Weak Trend, Bearish Direction]
- Volume: 104.78M, among the highest bars of the last several weeks (comparable only to the Jul and Jun spikes). A gap-down on heavy volume suggests a decisive repricing or breakdown, not a quiet drift. It could also mark capitulation if price quickly recovers. [Bearish / Breakdown Volume]
DIVERGENCES & TRENDS
- No clear divergence on RSI or MACD. Both made lower highs together with price over the last two weeks. The RSI peak at 57 (Oct 20) came with a MACD peak at 1.64 and price near $262, and all have rolled over together.
- CMF vs price: CMF has turned positive (+0.096) while price made a new low. This is a mild bullish divergence, but it comes from one bar and needs confirmation.
- Moving average structure: Price is below EMA 21, EMA 55, SMA 50D ($254.28), and VWAP ($251.80). It has also slipped below SMA200D ($243.40) for the first time since the Jul lows, which breaks long-term support.
- No golden or death cross. SMA 50D ($254.28) remains above SMA 200D ($243.40) with a gap of about $11 that is narrowing. The 50D is rolling over, so a death cross is a risk later, but not within the next few weeks.
- Crossovers: EMA 21 crossed below EMA 55, MACD crossed below signal, and −DI crossed above +DI. All are bearish.
- Range behavior: From Aug to Oct, price traded a range of roughly $243-$262 with ADX falling to the low teens. This gap-down is a range breakdown.
CHART PATTERNS
- Bearish Triple Top / rectangle breakdown (reference diagram): Repeated rejections near $262-$264 (Oct 19-21 and earlier) against a floor near $243-$245 resolved to the downside with a heavy-volume gap below the range. A measured move equals the range height of ~$19, which gives a target of roughly $224-$225 from the ~$243 breakdown level.
- Possible bearish flag/pennant aftermath: The Oct 19-28 bounce failed under the 21/55 EMAs, consistent with a lower-high sequence.
- Counter-view: The Jun and Jul lows (~$229-$232) formed a Bullish Double Bottom-type base that launched the Jul-Aug rally. A retest of that area is a plausible spot for buyers to defend.
- Because ADX is weak, a failed breakdown (bear trap) back into the range is a real possibility.
POTENTIAL SCENARIOS
- Scenario 1: Bearish Range Breakdown Continuation — The heavy-volume break below the range and SMA200D leads to a drift lower toward the Jun-Jul lows, with rallies capped by $243-$252. Trigger: Daily closes below $238 and failure to reclaim SMA200D at $243.40. Target: $230, with an extension to $222-$225 (measured move). Invalidation: Daily close above $252 (EMA 21/VWAP). (45% probability)
- Scenario 2: Bullish Snapback / Failed Breakdown — Price is stretched below the lower Bollinger Band with RSI near 38 and CMF turning positive. A reclaim of SMA200D pulls price back to the middle of the range. Trigger: Close above $243.40-$245 on solid volume. Target: $252-$254 (EMAs/VWAP/SMA 50D), possibly $258. Invalidation: Close below $233. (38% probability)
- Scenario 3: Neutral Choppy Base — Price stabilizes near the Jun-Jul support and the 200D and chops between $230 and $248 with ADX staying low. Trigger: Several closes between $234 and $247. Target: ~$240. Invalidation: Decisive close outside $230-$250. (17% probability)
PRICE TARGETS
- Target Price: $235.50 (34-day, Dec 5, 2026)
- Expected Range: $219.00 to $255.00 (width $36, ~15% of current price, consistent with the 30-60 day guidance of 12-18%)
- Key Levels: Support at $230.00 (Jun-Jul swing lows), Resistance at $243.40 (SMA200D, now overhead, with $252-$254 behind it from EMAs/VWAP/SMA 50D)
OVERALL BIAS
OVERALL BIAS: BEARISH - Price broke below the Aug-Oct range and the 200-day SMA on heavy volume, with a bearish MACD cross, −DI far above +DI, and EMA 21 under EMA 55, all pointing lower. The oversold-ish RSI, the close below the lower band, and positive CMF argue for a bounce, which caps conviction, but overhead resistance at $243-$252 favors a modest downside bias over 34 days.
This is educational analysis and not financial advice.