NOK 34-day bearish forecast — Nov 1, 2026
- Bias: Bearish
- Timeframe: 34 days (made Nov 1, 2026, target date Dec 4, 2026)
- Price at analysis: $8.56
- Price target: $8.20
- Expected range: $7.50 – $8.90
- Result: Pending — graded after the close on Dec 4, 2026
Get a free AI analysis of NOK today
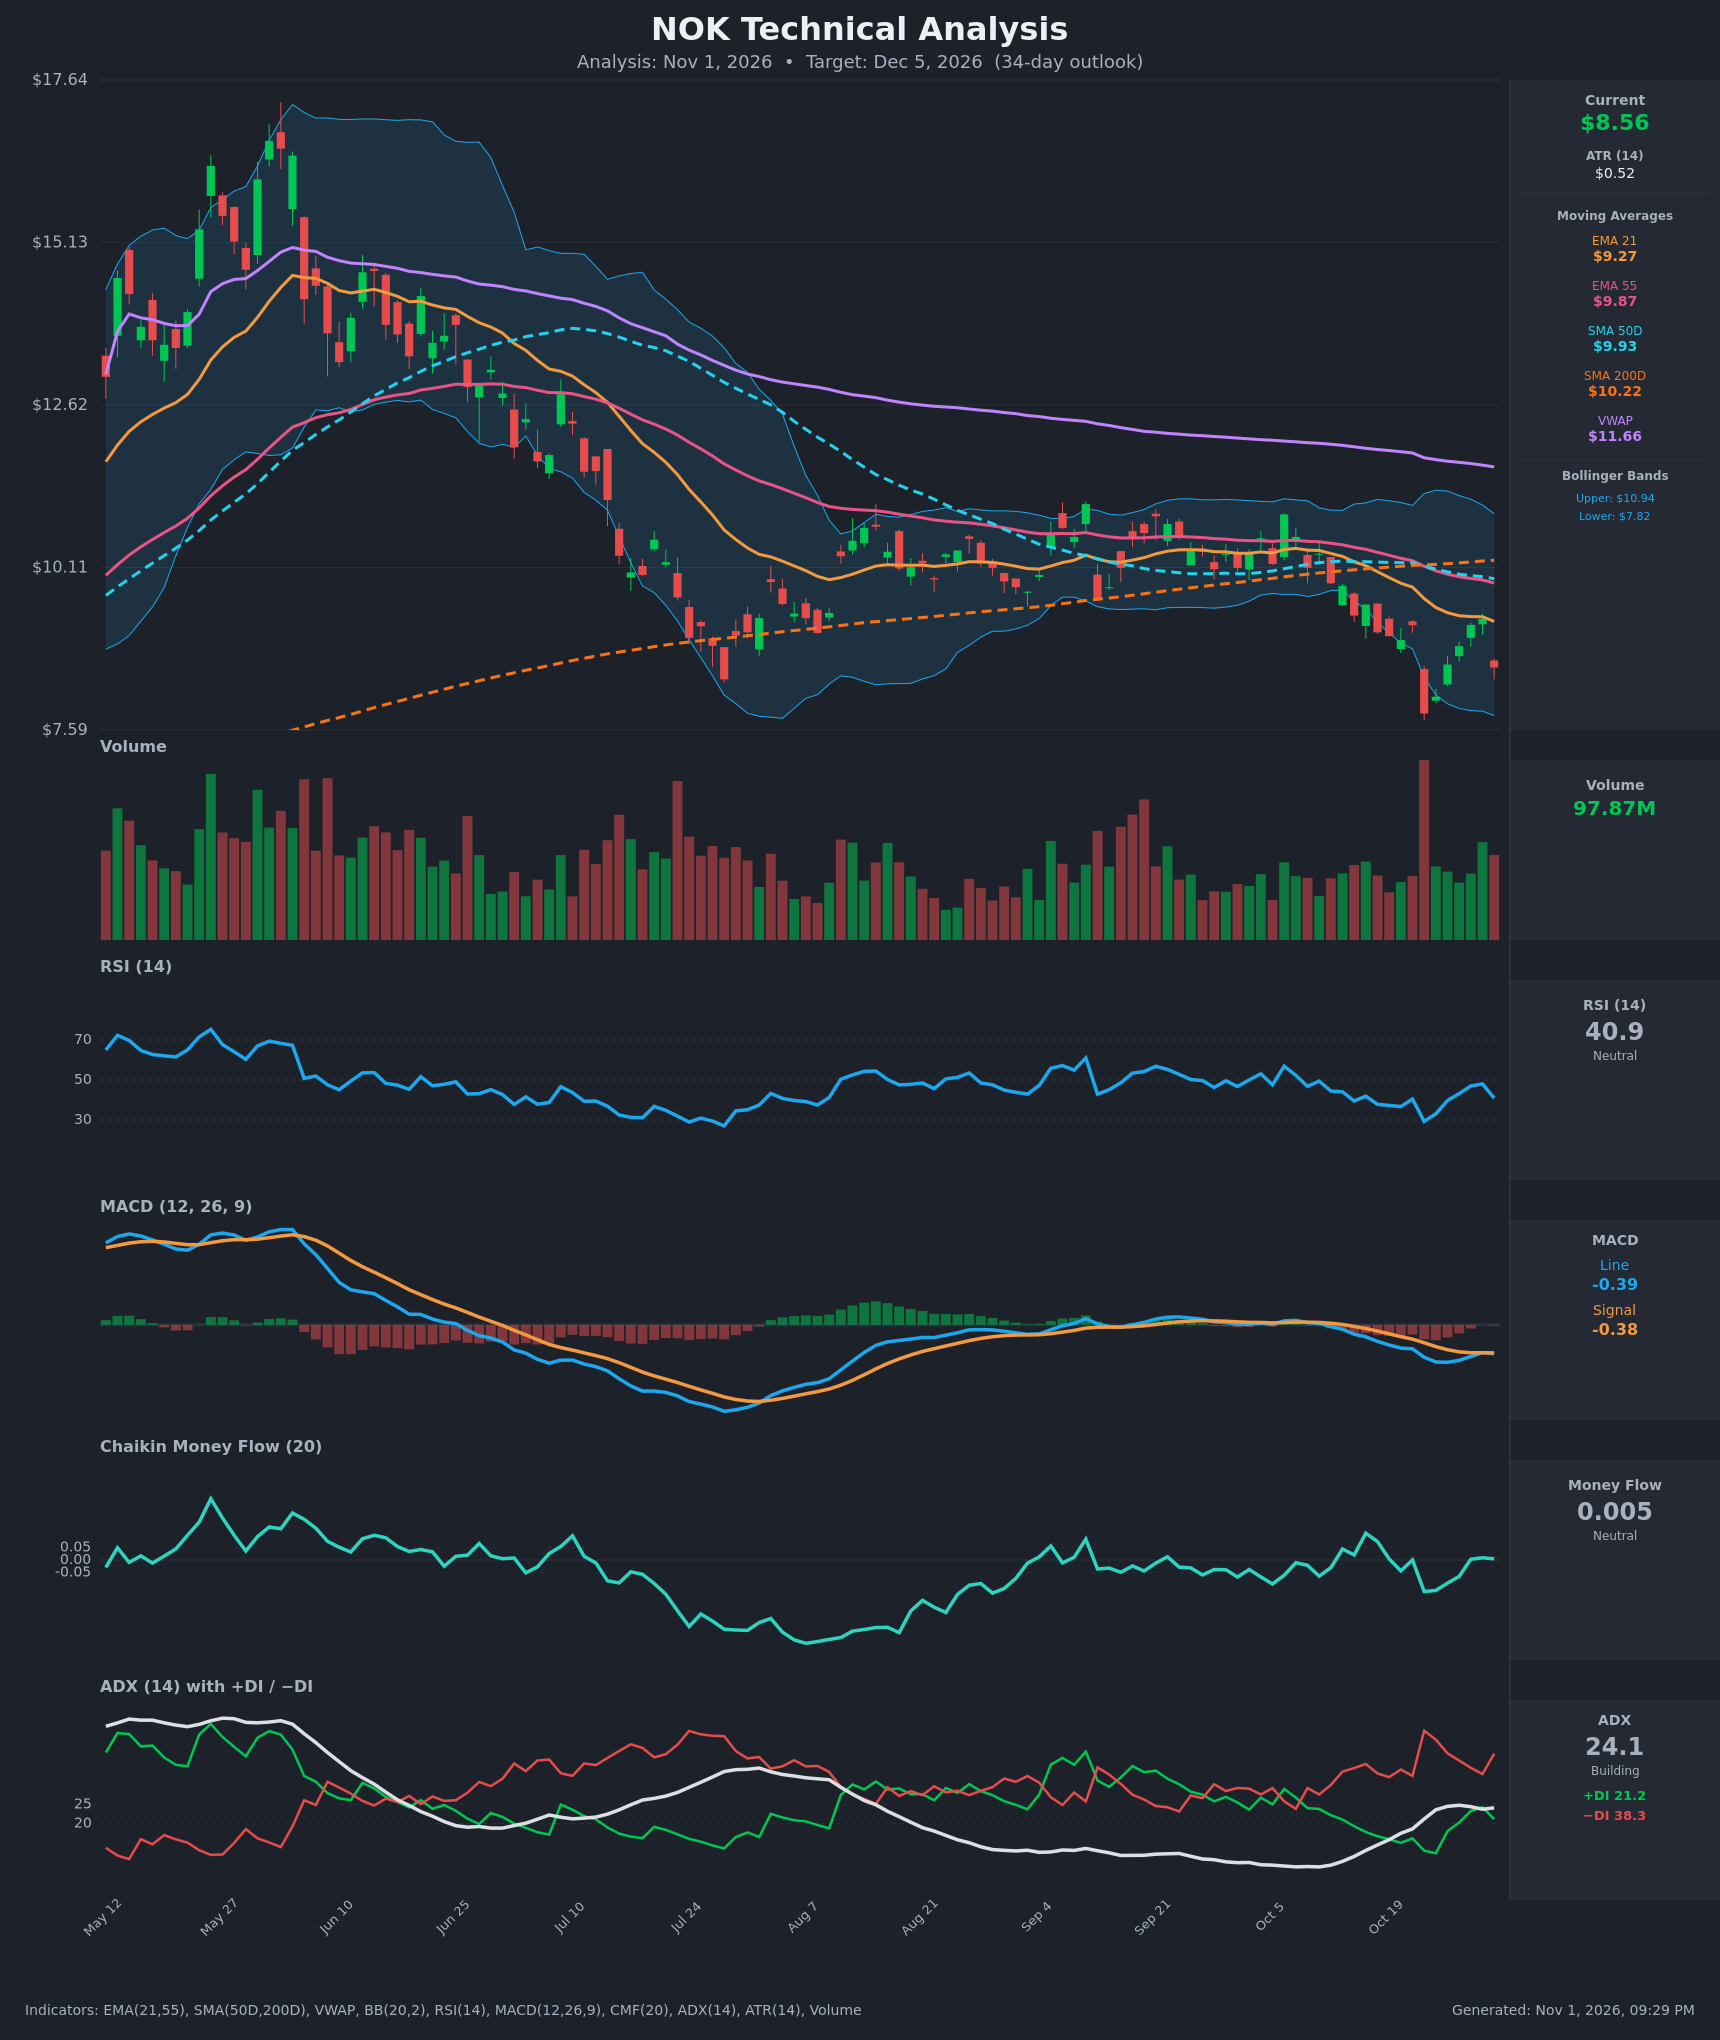
Analysis
TECHNICAL INDICATORS
- RSI (14): 40.93, down sharply from 48.0 on Oct 29 after the 8% drop on Oct 30. It is below 50 but above oversold (the Oct 22 low was 29.3). The bounce from oversold has stalled and momentum is turning down again. [Bearish]
- 20 EMA (EMA 21 = $9.27): Price at $8.56 is about 7.7% below the EMA21. On Oct 29 it tested the EMA21 ($9.31 vs $9.34) and was rejected. EMA21 is below EMA55 ($9.87), so the short-term trend is down and the EMA21 acts as resistance. [Bearish]
- MACD: Line -0.386 is below Signal -0.376, with a histogram of about -0.010. The line crossed back below the signal on Oct 30 after a brief approach. Both lines are negative, so momentum is bearish but shallow. [Bearish]
- Bollinger Bands (20): Upper $10.94, lower $7.82, midline about $9.38. Price is in the lower third of the bands, about $0.74 above the lower band, with wide bands after the Oct 22 volatility. This is not an extreme reading, so there is room to test the lower band near $7.82. [Bearish]
- CMF (20): 0.005, inside the neutral zone (±0.05). It has hovered around zero after dipping to -0.126 on Oct 22, so there is neither accumulation nor distribution. [Neutral]
- ADX (14): 24.1 and rising, nearly at the 25 trend threshold. −DI (38.3) is far above +DI (21.2), and the gap widened on the last bar. Bears are in control and the trend is strengthening. [Strong/Building Trend – Bearish]
- Volume: 97.87M on the latest red candle, among the heaviest bars on the chart. It is above the recent average, apart from the Oct 22 capitulation spike. The Oct 30 reversal on heavy volume signals active selling and a failed bounce. [Bearish – distribution on the down day]
DIVERGENCES & TRENDS
- Death cross: SMA50D ($9.93) is below SMA200D ($10.22). The cross happened around Oct 22, confirming a long-term downtrend. Price is below the SMA50D, SMA200D and VWAP ($11.66), which is far overhead.
- MA stack: Price < EMA21 < EMA55 < SMA50D < SMA200D < VWAP is fully bearish, with every average sloping down.
- DI trend: −DI has stayed above +DI throughout the 15 bars. The brief narrowing to 23.3 vs 34.6 on Oct 28–29 was reversed by Oct 30.
- No clear bullish divergence: The Oct 22 low of $7.85 came with RSI at 29.3. RSI is back at 40.9 and price is well above the low, so no divergence is confirmed.
- Failed recovery: The bounce from $7.85 to $9.31 ended at the EMA21 and was fully rejected, a lower high within the downtrend.
- Price structure: After a range around $10–10.5 from Aug to Oct, price broke below the SMA200D and range support. This confirms the breakdown.
CHART PATTERNS
- Descending move after a range breakdown: The chart shows a multi-month decline from about $17 to $8. The Aug–Oct consolidation under $10.5–11 resembles a Bearish Flag/Rectangle continuation, which resolved lower on the Oct 22 break. The measured move from the range (about $0.8–1.0 of height) points toward $7.5–8.0, near the Oct 22 low.
- Possible Bullish Double Bottom (low probability): A retest of $7.85 that holds would build a double bottom with a neckline near $9.30. It is not confirmed, because the bounce failed at the EMA21 and the lower high suggests a retest of the low is more likely.
- Key levels: A break below $7.85 would confirm continuation toward $7.20–7.40. A reclaim of $9.30 would invalidate the near-term bearish bias.
POTENTIAL SCENARIOS
- Scenario 1: Bearish Continuation and Retest of Lows — The failed bounce at the EMA21, −DI dominance with ADX rising, and the MACD re-cross lead to a retest of the $7.85 low. Price could poke toward the lower Bollinger Band near $7.82, with a drift toward $8.20 by Dec 5. Trigger: daily close below $8.30, then a break of $7.85. Target: $8.20 (base case), $7.30 if $7.85 breaks. Invalidation: daily close above $9.30. (50% probability)
- Scenario 2: Neutral Range Between the Oct Low and the EMA21 — Price oscillates between $7.85 support and the $9.27 EMA21 resistance, as it did over the last two weeks. CMF near zero supports this, and the ADX is not yet above 25. Trigger: holds above $7.85 without a close above $9.30. Target: $8.30–$8.90. Invalidation: close outside $7.80–$9.35. (25% probability)
- Scenario 3: Bullish Double-Bottom Recovery — Price holds the $7.85 area, RSI turns up and MACD crosses up, and price reclaims the EMA21 and EMA55. Trigger: daily close above $9.30 on volume above 100M. Target: $9.87 (EMA55), then $10.20 (SMA200D). Invalidation: close below $7.85. (25% probability)
PRICE TARGETS
For the 34-day horizon (through Dec 5, 2026), the expected range is $7.50 to $8.90, a width of $1.40, or about 16.4% of the current price, which fits the 30–60 day guidance of 12–18%. The ATR of $0.52 suggests roughly ±$0.9–1.0 of typical movement over this period, consistent with this range.
- Target Price: $8.20
- Expected Range: $7.50 to $8.90
- Key Levels: Support at $7.85, Resistance at $9.27
OVERALL BIAS
OVERALL BIAS: BEARISH - Price is below every moving average with a death cross in place, −DI (38.3) is well above +DI (21.2) with ADX rising, MACD just re-crossed down, and the bounce was rejected at the EMA21 on heavy volume. Neutral CMF and a still-viable $7.85 support leave room for a range or relief bounce, so conviction is moderate.
This is educational analysis and not financial advice.