AAL 34-day bullish forecast — Nov 1, 2026
- Bias: Bullish
- Timeframe: 34 days (made Nov 1, 2026, target date Dec 4, 2026)
- Price at analysis: $12.60
- Price target: $13.20
- Expected range: $11.90 – $14.00
- Result: Pending — graded after the close on Dec 4, 2026
Get a free AI analysis of AAL today
Analysis
TECHNICAL INDICATORS
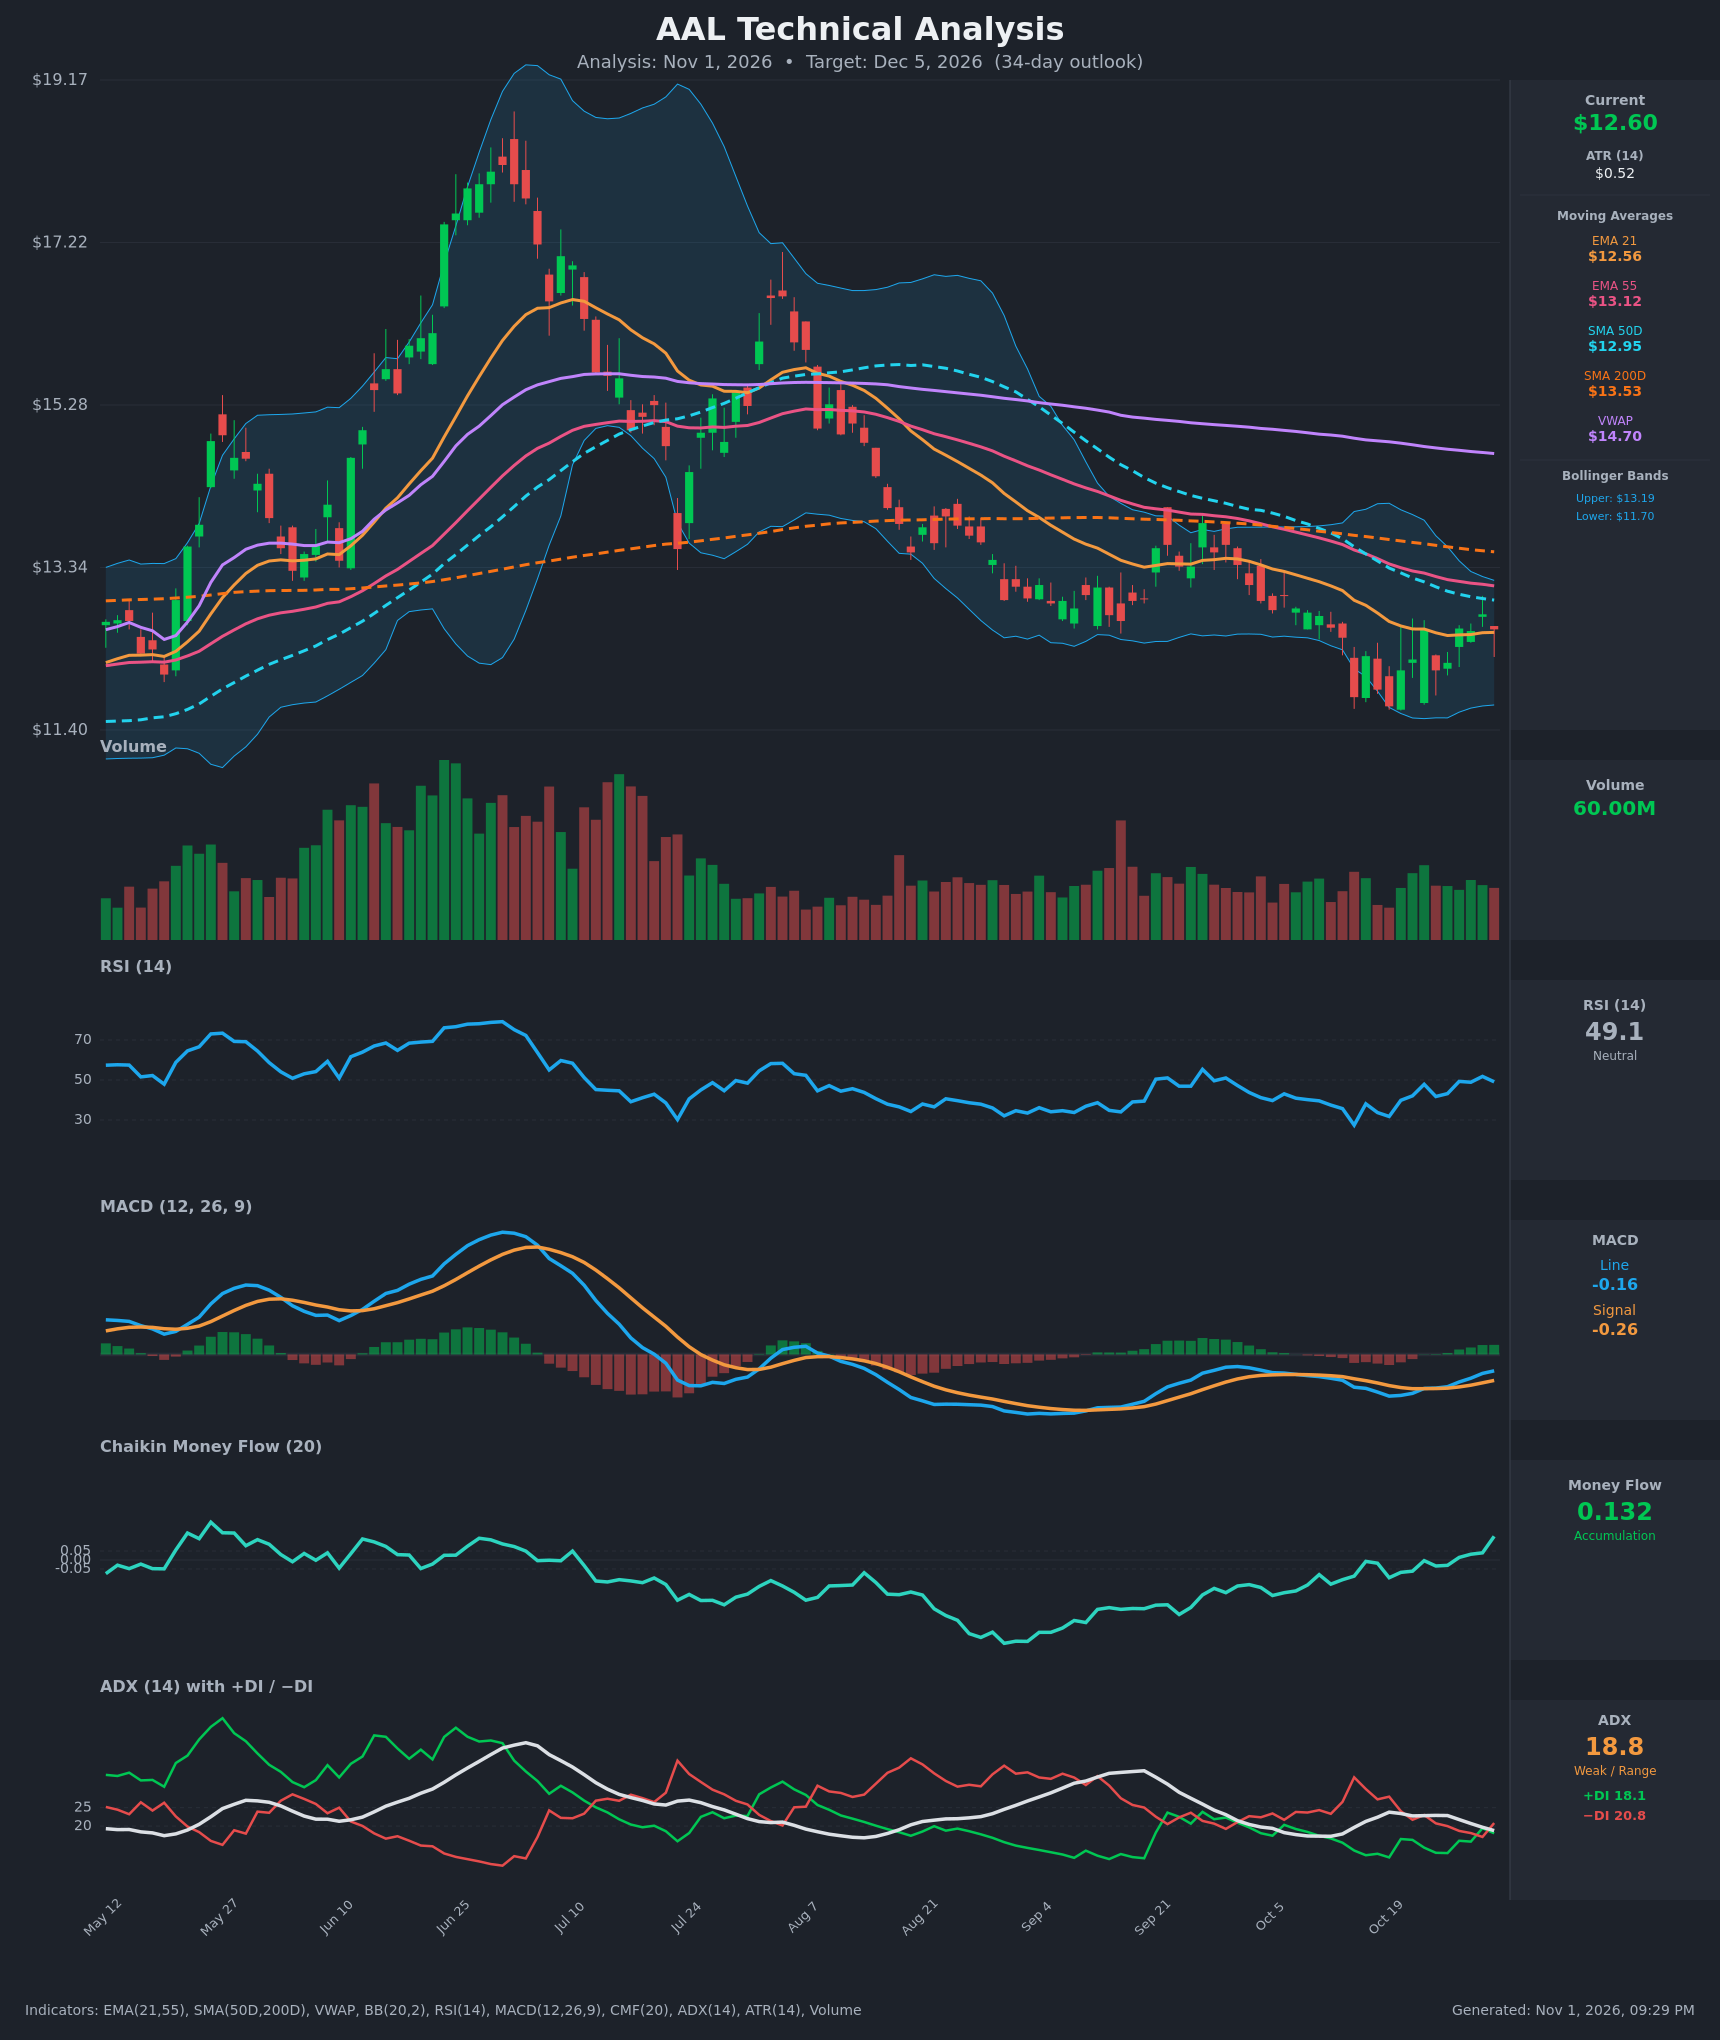
- RSI (14): 49.08, right at the neutral midline. It has recovered from oversold (27.4 on Oct 14) and is making higher lows, so momentum is improving but not yet strong. [Neutral]
- 20 EMA: The 21 EMA is $12.56 and price ($12.60) sits just above it. The EMA has flattened after a long decline, so it is acting as marginal support. The 21 EMA is still below the 55 EMA ($13.12), so there is no bullish EMA crossover yet. [Neutral]
- MACD: The line (-0.164) crossed above the signal (-0.260) around Oct 22. The histogram is positive and widening (about +0.10), but both lines are still below zero. This is an early bullish momentum turn within a larger downtrend. [Bullish]
- Bollinger Bands (20): Upper $13.19, lower $11.70, midline about $12.44. Price is just above the midline after bouncing from the lower band area ($11.68 low on Oct 19). The bands are narrowing, which points to compression and a possible volatility expansion. The upper band near $13.19 is the first major test. [Neutral]
- CMF (20): 0.132, up from -0.135 on Oct 12 and above the +0.05 threshold. It has been rising steadily since Oct 19, which suggests real accumulation on the bounce. [Accumulation]
- ADX (14): 18.8 and falling, so the trend is weak or range-bound. −DI (20.8) is only slightly above +DI (18.1), and the gap has narrowed sharply from 33 vs 13 on Oct 14. Sellers are losing control, but buyers have not taken over. [Weak Trend, slight bearish lean fading]
- Volume: 60.00M, steady and near average, with no capitulation or breakout spike. Recent up days show slightly better volume than the late-October down days, which is mildly supportive. [Neutral to mildly Bullish]
Other moving averages and VWAP: price is below the SMA50 ($12.95), SMA200 ($13.53) and VWAP ($14.70). The SMA50 is below the SMA200 (a death-cross structure), so the long-term trend is still down. The SMA50 is also flattening and sits just overhead.
DIVERGENCES & TRENDS
- Bullish divergence: Price made a lower low around $11.68 on Oct 19, while RSI (31.8) and MACD recovered quickly. CMF has turned sharply positive from deeply negative, even though price is still below the major MAs.
- Indicator trends: RSI, MACD histogram and CMF are all rising. ADX is falling and the DI spread is closing, so the downtrend is losing strength.
- Crossovers: The MACD bullish signal-line cross (Oct 22) is confirmed. A +DI/−DI crossover is imminent. Price has reclaimed the 21 EMA but remains under the 55 EMA, SMA50, SMA200 and VWAP, which form a stacked overhead resistance zone between $12.95 and $13.53.
- Long-term context: Lower highs since June and price well below VWAP ($14.70) show that the larger trend is bearish. The recent improvement is a bottoming attempt, not a confirmed reversal.
CHART PATTERNS
- Bullish Double Bottom (developing): Lows at about $11.79 (Oct 14) and $11.68 (Oct 19) form a base. The neckline is roughly $13.0–$13.2, the recent swing high and the confluence of the SMA50, EMA55 and upper Bollinger Band. A close above that zone would give a measured target near $14.5 (neckline minus low, about $1.4, projected up). That is beyond the 34-day horizon, so I expect only partial progress.
- Possible Bullish Falling Wedge or Descending Channel: The decline from August has been compressing, with a tightening Bollinger Band range and falling ADX. This supports a reversal bias, but it needs a breakout confirmation.
- Risk pattern: Persistent lower highs and the SMA200 declining overhead resemble a bearish continuation (descending-type structure). A break below $11.68 would invalidate the double bottom and open $10.8–$11.0.
POTENTIAL SCENARIOS
- Scenario 1: Bullish Base Breakout — The double-bottom base holds, with accumulation (CMF) and the MACD turn pushing price through the $12.95–$13.19 resistance cluster (SMA50, EMA55, upper BB). Trigger: daily close above $13.20 on rising volume. Target: $13.20–$13.60 (SMA200 area), with an extension to $14.00. Invalidation: close below $12.10, then below $11.68. (50% probability)
- Scenario 2: Neutral Range Chop — Weak ADX and overhead MA resistance keep price between the 21 EMA and the SMA50/EMA55 band. Trigger: repeated rejections at $12.95–$13.15 with support at $12.10–$12.40. Target: $12.20–$12.90. Invalidation: a decisive close above $13.20 or below $11.90. (25% probability)
- Scenario 3: Bearish Failure at Resistance — The bounce stalls under the stacked MAs and the SMA200/VWAP downtrend reasserts itself. Trigger: rejection at $12.95–$13.12 and a close below the 21 EMA and $12.10. Target: retest of $11.70, with a possible breakdown to $11.00. Invalidation: close above $13.20. (25% probability)
PRICE TARGETS
- Target Price: $13.20 (34-day horizon)
- Expected Range: $11.90 to $14.00 (width $2.10, about 16.7% of the current price, consistent with the 30-60 day guidance of 12-18%)
- Key Levels: Support at $12.10 (major support at $11.70), Resistance at $12.95 (next at $13.19 and $13.53)
OVERALL BIAS
OVERALL BIAS: BULLISH - Momentum is turning up, with a bullish MACD cross, CMF accumulation at 0.132, a fading −DI advantage, and a double-bottom base near $11.70. Modest conviction, because price is still below the SMA50, SMA200 and VWAP, so the rally must clear $12.95–$13.20 to confirm.
This is educational analysis and not financial advice.