NVDA 34-day bearish forecast — Nov 1, 2026
- Bias: Bearish
- Timeframe: 34 days (made Nov 1, 2026, target date Dec 4, 2026)
- Price at analysis: $204.64
- Price target: $198.00
- Expected range: $182.00 – $214.00
- Result: Pending — graded after the close on Dec 4, 2026
Get a free AI analysis of NVDA today
Analysis
TECHNICAL INDICATORS
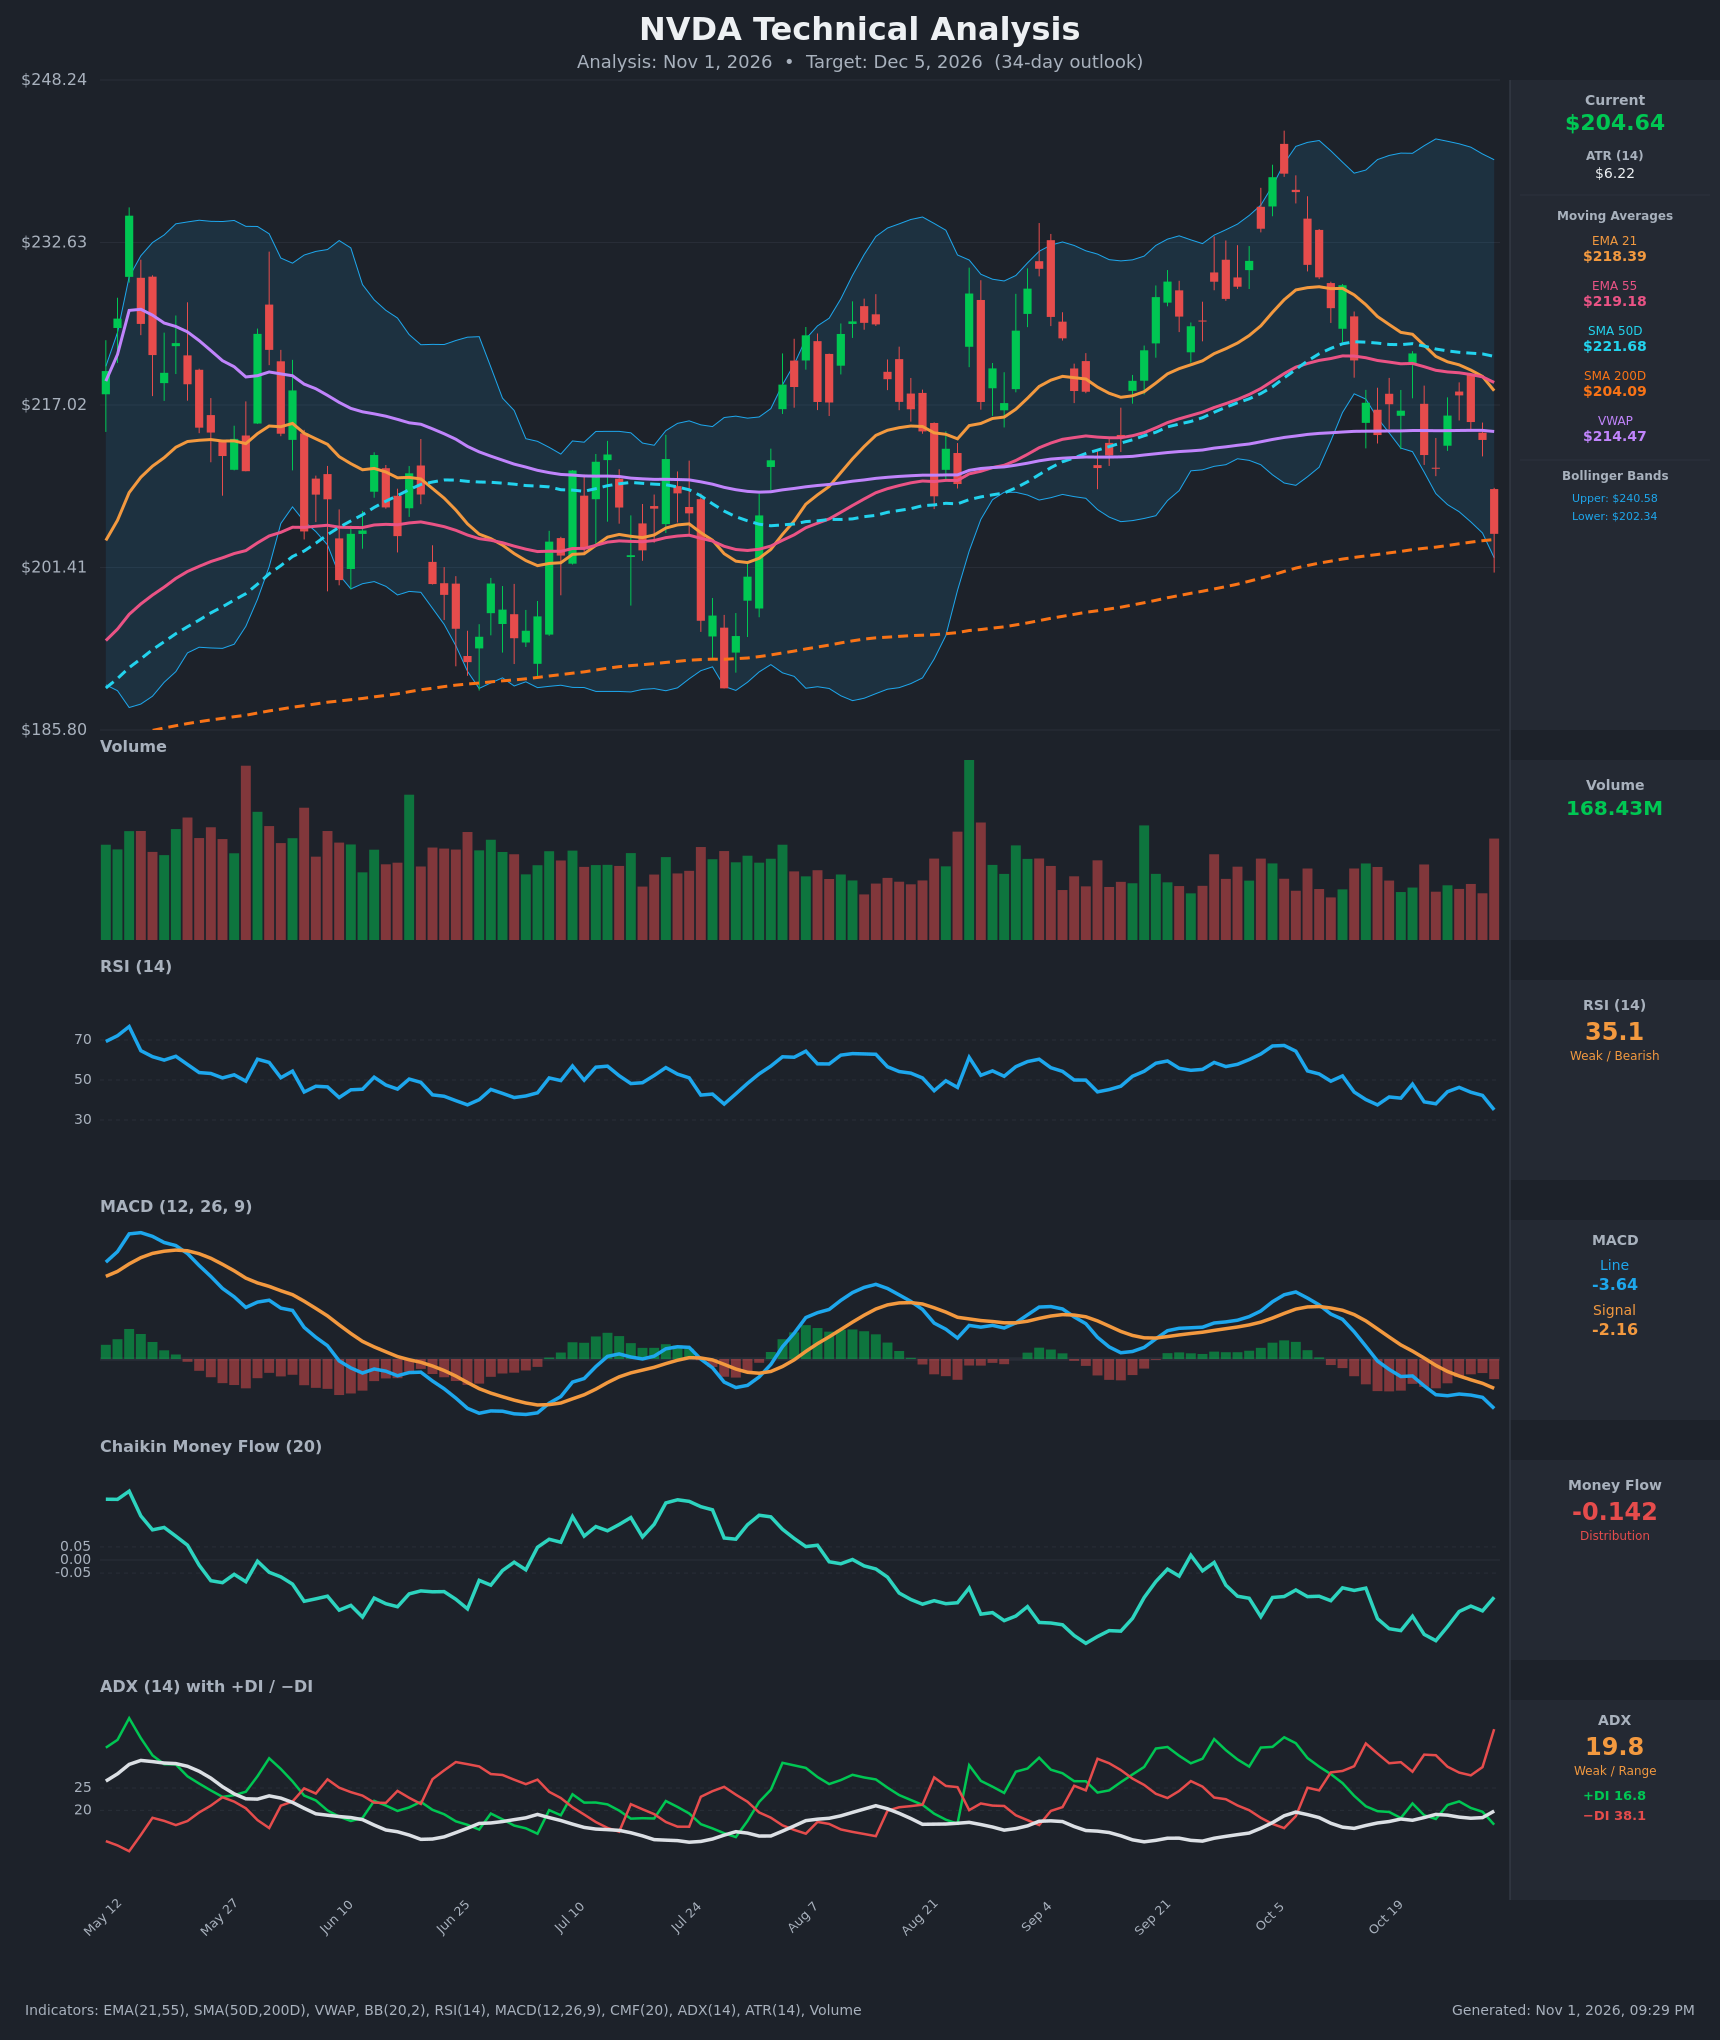
- RSI (14): 35.07, down from 47.9 on Oct 21 and approaching oversold (<30) but not there yet. Momentum is falling, with lower highs on each bounce since Oct 13 (52.0). [Bearish]
- 20 EMA (EMA 21): $218.39. Price at $204.64 is about 6.3% below it, and the EMA is sloping down. EMA 21 ($218.39) has crossed below EMA 55 ($219.18), a short-term bearish cross. The EMA 21 is now overhead resistance. [Bearish]
- MACD: Line -3.64 is below Signal -2.16, with the bearish crossover on Oct 16. The histogram is negative and widening (about -1.48), and both lines are below zero. [Bearish]
- Bollinger Bands (20): Upper $240.58, lower $202.34. Price at $204.64 sits just above the lower band, which has been widening after a strong band expansion. Price is riding the lower band after a -4.2% drop on the day. A lower-band touch in a downtrend often signals continuation, though a mean-reversion bounce is possible. [Bearish]
- CMF (20): -0.142, well below -0.05 and negative throughout the recent window (-0.10 to -0.31). This shows persistent distribution. [Distribution]
- ADX (14): 19.8, rising slightly from 16.0. +DI 16.8 versus −DI 38.1, so bears are firmly in control. The trend is not yet strong, but −DI is spiking and ADX is turning up. [Weak Trend, Bearish direction]
- Volume: 168.43M, the highest in recent weeks, on a large red candle that broke down to $204.64. The heavy volume on a down day confirms selling pressure. [Bearish — distribution/breakdown volume]
DIVERGENCES & TRENDS
- No bullish RSI divergence yet. RSI and price are both making lower lows, so the move is confirmed rather than diverging.
- MACD fell from +3.3 (Oct 12) to -3.6. It crossed below the signal on Oct 16 and the gap is widening.
- Price is below EMA 21, EMA 55, SMA50D ($221.68) and VWAP ($214.47). It is only just above the SMA200D ($204.09), which is the last major support.
- Price has fallen from the ~$240 peak in early October, with a series of lower highs and lower lows.
- The SMA50D ($221.68) is well above the SMA200D ($204.09), so there is no death cross, but the gap is narrowing as the SMA50D rolls over.
- CMF has failed to turn positive since the Sept 21 rally, which signals weak accumulation.
- The lower Bollinger Band was touched in June and July, and price bounced then. Those bounces are a possible template, but the current trend is more bearish.
CHART PATTERNS
- Price is forming a Bearish Head and Shoulders / Double Top from the ~$236–240 highs in early October (a lower high in the Oct 5 area against Sept highs). The neckline is roughly the $210–213 zone, which price has just broken. The measured move points to roughly $185–195.
- The SMA200D at ~$204 is the key support, tested right now. The June–July lows near $190–195 (the Bollinger-band-bounce zone) form the next support.
- The pullback since Oct 12 is a descending channel (lower highs, lower lows). That could resolve as a Bullish Falling Wedge if a reversal appears, but there is no confirmation yet.
- The overall structure matches the Bearish Head and Shoulders reversal pattern and a breakdown below the neckline.
POTENTIAL SCENARIOS
- Scenario 1: Bearish Breakdown Below SMA200D — Price breaks the SMA200D (~$204) and the lower band on heavy volume, with −DI dominant and MACD widening. Trigger: daily close below $202 with sustained CMF below -0.10. Target: $190–$195, the June/July lows and the head-and-shoulders measured move. Invalidation: close back above $214 (VWAP). (50% probability)
- Scenario 2: Neutral Consolidation / Oversold Bounce — The SMA200D holds, RSI near 30 triggers a relief bounce, and price ranges between $198 and $216. Trigger: bullish RSI divergence or a close above $210. Target: $212–$216 (VWAP, EMA 21 region). Invalidation: close below $198. (30% probability)
- Scenario 3: Bullish Reversal — A sharp rebound from the 200-day with an MACD turn and a reclaim of EMA 21/55. Trigger: close above $219 on rising volume with CMF above 0. Target: $228–$233. Invalidation: failure at $214–$219 and a close below $200. (20% probability)
PRICE TARGETS
- Target Price: $198.00 (34-day)
- Expected Range: $182.00 to $214.00 (width $32, about 15.6% of price, consistent with the 30–60 day guidance of 12–18%)
- Key Levels: Support at $196.00 (recent swing lows and the area below the 200-day), Resistance at $214.47 (VWAP and the broken neckline region)
OVERALL BIAS
OVERALL BIAS: BEARISH - Price is below every key moving average and VWAP with a bearish MACD cross, −DI far above +DI, persistent CMF distribution, and a high-volume breakdown that tests the SMA200D. The SMA200D at ~$204 is the last support before a measured move toward the high-$190s.
This is educational analysis and not financial advice.