ORCL 34-day bearish forecast — Nov 1, 2026
- Bias: Bearish
- Timeframe: 34 days (made Nov 1, 2026, target date Dec 4, 2026)
- Price at analysis: $130.67
- Price target: $125.50
- Expected range: $116.00 – $138.00
- Result: Pending — graded after the close on Dec 4, 2026
Get a free AI analysis of ORCL today
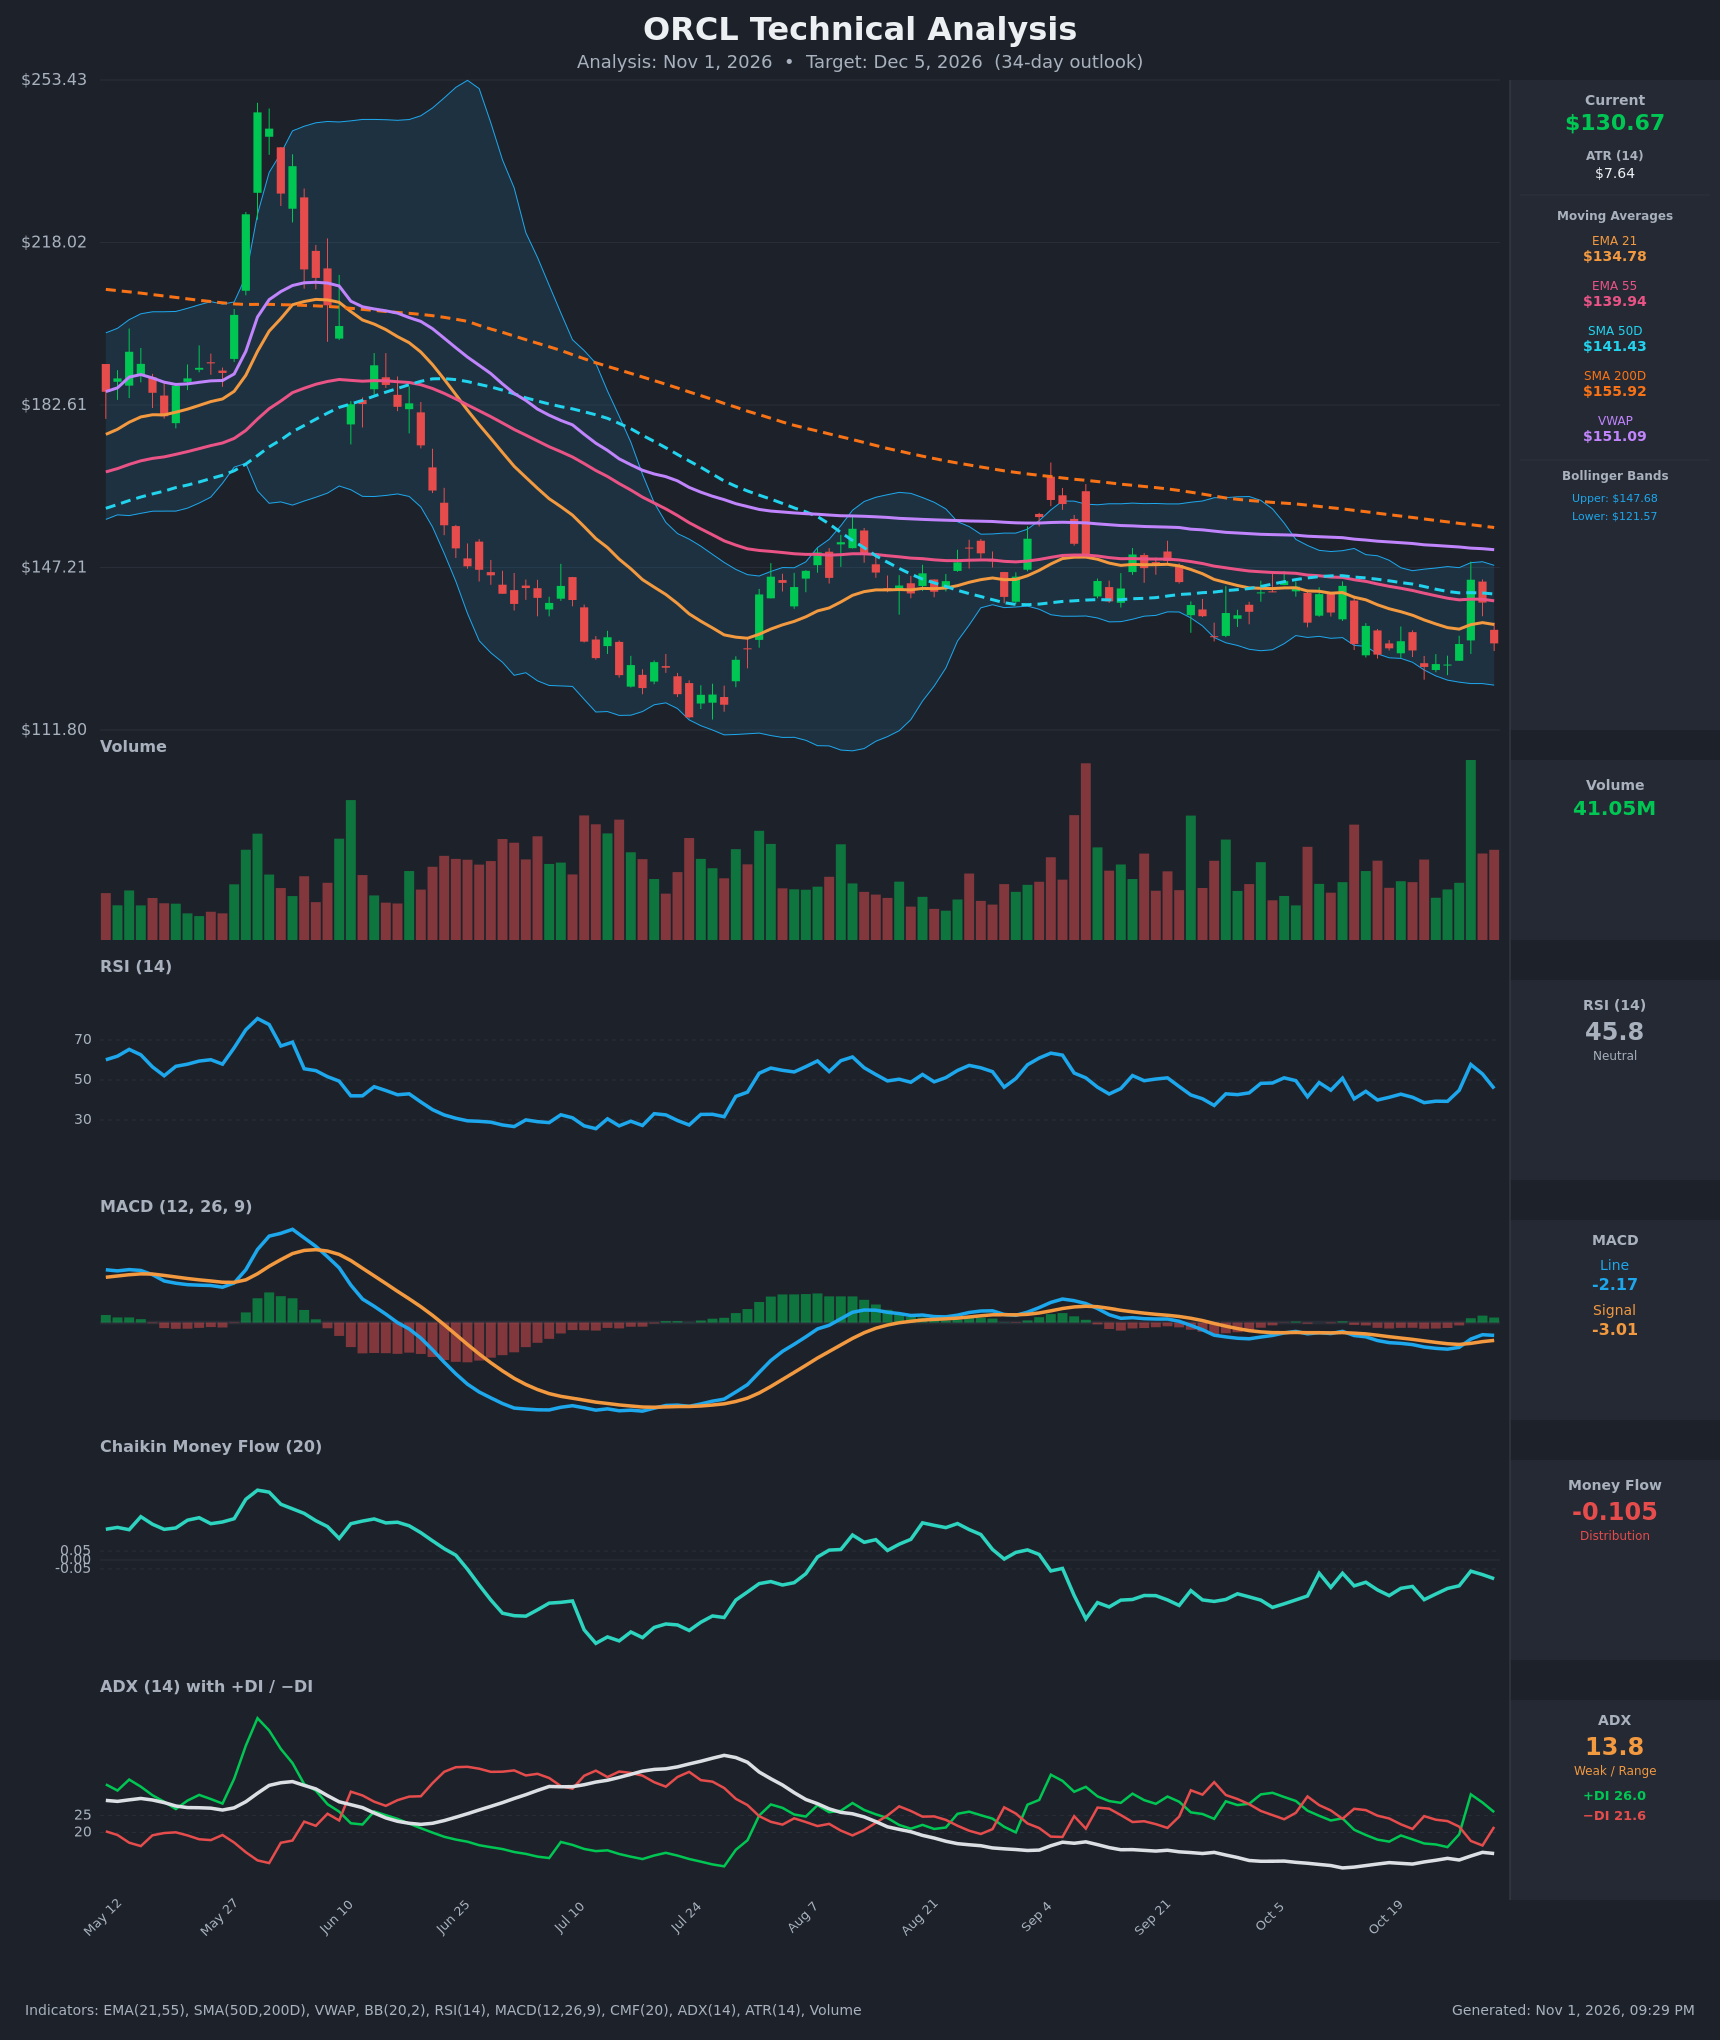
Analysis
TECHNICAL INDICATORS
- RSI (14): 45.76, below the 50 midline after spiking to 57.8 on Oct 28 and rolling over. It hasn't reached oversold (<30) and has made lower highs through the downtrend, so momentum is mildly weak. [Bearish]
- 20 EMA (EMA 21): $134.78, with price at $130.67 below it. EMA 21 is also below EMA 55 ($139.94), so it acts as overhead resistance. The Oct 28 spike to $144.54 was rejected quickly. [Bearish]
- MACD: Line -2.17 sits above Signal -3.01, a bullish crossover that occurred on Oct 28. The histogram is slightly positive, but both lines are still below zero and the line is flattening after the latest down day. This is a weak, early momentum improvement inside a downtrend. [Neutral]
- Bollinger Bands (20): Upper $147.68, lower $121.57, midline about $134.63. Price is in the lower half of the bands, below the midline. The bands are fairly narrow compared with the spring volatility, so volatility is low. The Oct 28 spike hit the upper half but fully reversed. [Bearish]
- CMF (20): -0.105, below the -0.05 threshold and negative for months. This shows persistent distribution and no sign of sustained accumulation. [Distribution]
- ADX (14): 13.8, a weak trend or range, with +DI 26.0 over -DI 21.6. The +DI lead is recent and stems from the Oct 28 spike, and -DI is rising again. A low ADX means the directional signal is unreliable. [Weak Trend, slight bullish DI tilt]
- Volume: 41.05M on the latest down day, after a huge-volume spike on the Oct 28 green candle. The big volume on the pop was followed by a red reversal on solid volume, which looks like a failed breakout or a sell-the-rip. Down days have broadly had heavier volume than up days since the summer. [Bearish]
DIVERGENCES & TRENDS
- Long-term structure: Price is far below SMA200D ($155.92) and SMA50D ($141.43), and the SMA50D is below the SMA200D, a death cross already in place. The 200D is still declining. Price fell from about $250 in June to about $130, a major downtrend.
- Moving averages: EMA21 < EMA55 < SMA50D < SMA200D is a fully bearish stack. Price is also below VWAP ($151.09), which indicates sellers are in control of the anchored average.
- MACD vs. price: The MACD crossed up on Oct 28 but was driven by one outsized candle. Price has since returned to $130.67, near the Oct 27 close of $130.53, so the crossover is already losing support and the histogram is likely to fade.
- Price vs. RSI: There is no clear bullish divergence. Price is near the Oct 22 low ($125.54) while RSI is higher (45.8 vs. 38.7), but the RSI strength comes from the bounce rather than a true higher low.
- CMF: It has stayed negative since late June, with no accumulation. Money flow does not confirm any base.
- ADX: It is below 20 and sloping lower, so the market is range-bound and choppy, with a compression of the daily range, rather than trending hard. Price has held a $122–$145 range since August.
CHART PATTERNS
- Descending trend/channel (bearish continuation): Lower highs and lower lows since June. Resistance is the falling EMA21/EMA55 cluster near $135–$140.
- Range (Aug–Oct): Price has oscillated roughly between $122–$126 and $145 for about three months. This is a loose consolidation, similar in spirit to a Bearish Rectangle/Triple Top rather than a clean textbook pattern. The Oct 28 spike was rejected at the range's upper half.
- Bearish Flag/Pennant (loose): The consolidation after the June–July drop and the August bounce resembles a bearish continuation structure. A breakdown below $122–$125 would project a measured move toward about $110, in line with the 2026 lows near $112.
- Support test: The $125–$126 area has been tested twice (Oct 22–26). A third test raises the odds of a breakdown, though a double bottom is possible if it holds.
POTENTIAL SCENARIOS
- Scenario 1: Bearish Breakdown Continuation — Price fails at the declining EMA21/EMA55 resistance, the failed Oct 28 breakout is confirmed, and distribution (CMF negative) pushes price through $125. Trigger: Daily close below $125.50 on above-average volume. Target: $116–$118, extended to about $112. Invalidation: Close above $140 (EMA55/SMA50D). (45% probability)
- Scenario 2: Neutral Range Chop — ADX stays below 20 and price oscillates between $124 and $140 as the market digests the drop. Trigger: Holds above $124 and stays under $140. Target: $128–$136. Invalidation: A close outside the $122–$142 range. (35% probability)
- Scenario 3: Bullish Relief Rally — The MACD crossover and the Oct 28 volume surge turn into a bounce toward the declining averages. Trigger: Close above $135 (EMA21) then $140. Target: $145–$148, the upper Bollinger Band. Invalidation: Close below $124. (20% probability)
PRICE TARGETS
For the 34-day timeframe (to about Dec 5, 2026), the guideline range width is about 12–18% of the current price. The Expected Range of $116.00 to $138.00 is $22.00 wide, or about 16.8%, within the guideline.
- Target Price: $125.50 (34-day)
- Expected Range: $116.00 to $138.00
- Key Levels: Support at $125.50, Resistance at $134.78
OVERALL BIAS
OVERALL BIAS: BEARISH - Price is below every major moving average in a fully bearish stack with a death cross in place, CMF shows persistent distribution (-0.105), and the Oct 28 spike was sold into immediately. The MACD crossover and +DI lead are weak, and the low ADX limits conviction, but the bearish evidence dominates.
This is educational analysis and not financial advice.