CRWV 34-day bearish forecast — Nov 1, 2026
- Bias: Bearish
- Timeframe: 34 days (made Nov 1, 2026, target date Dec 4, 2026)
- Price at analysis: $54.87
- Price target: $51.00
- Expected range: $47.20 – $57.00
- Result: Pending — graded after the close on Dec 4, 2026
Get a free AI analysis of CRWV today
Analysis
TECHNICAL INDICATORS
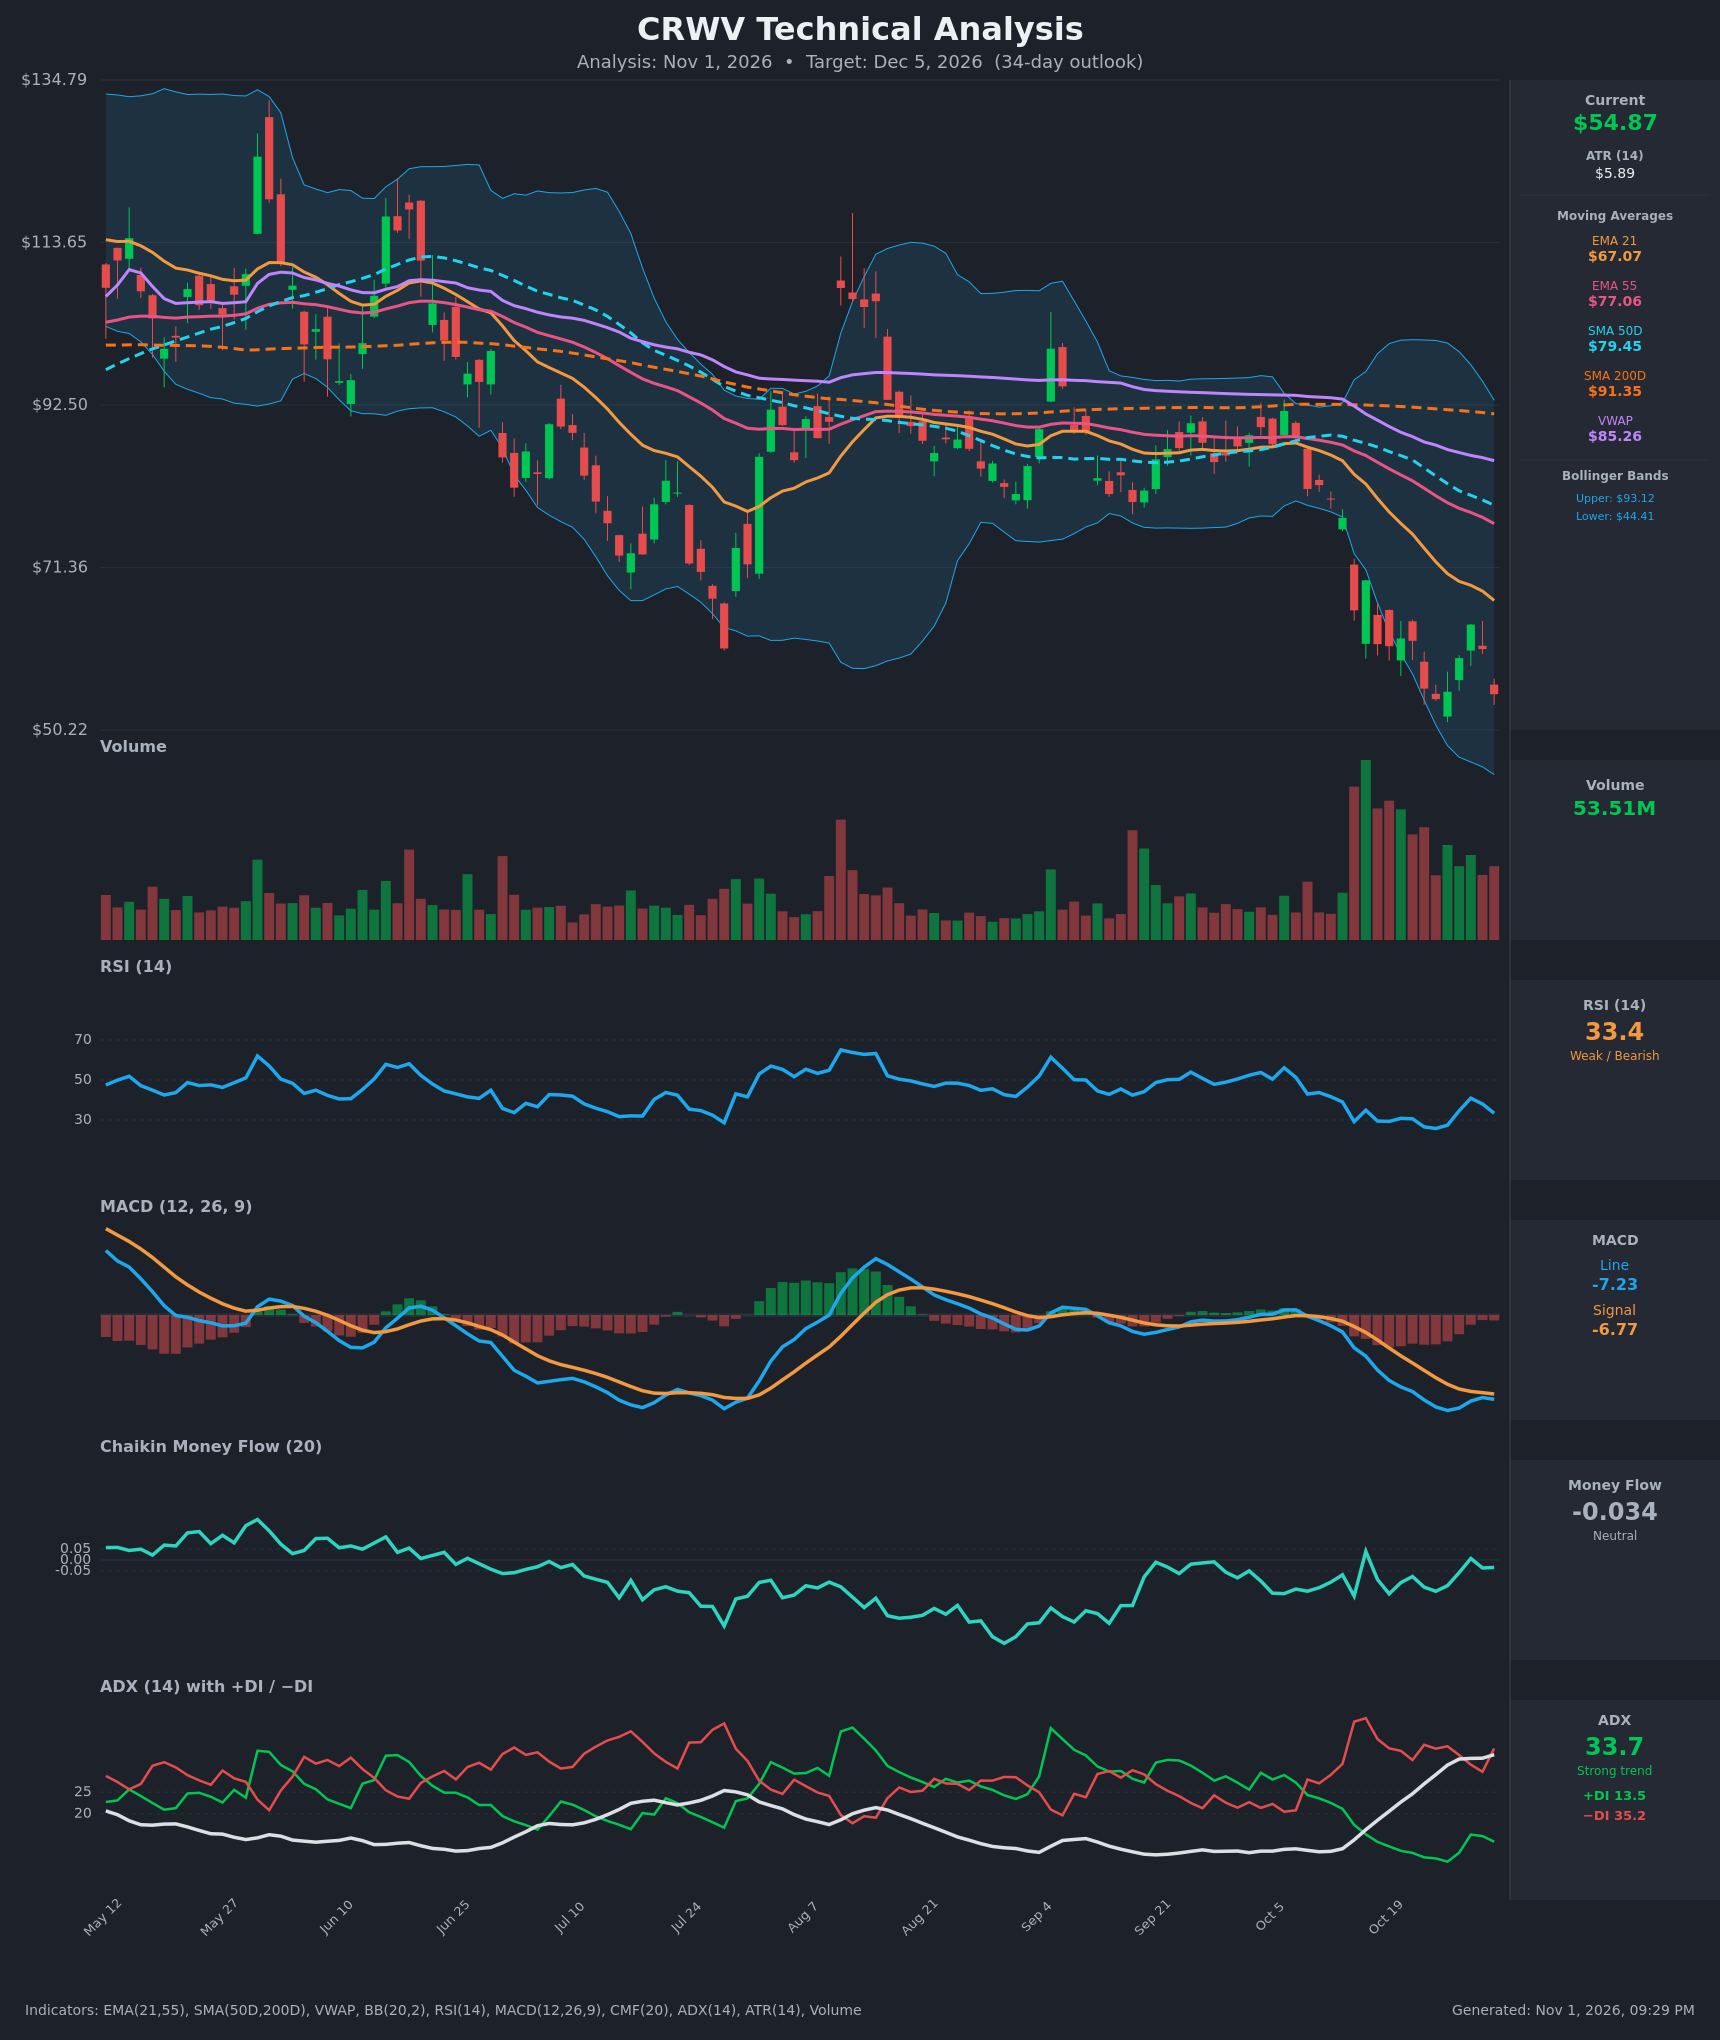
- RSI (14): 33.36, down from 40.9 on Oct 28 and close to oversold, but it has not reached the 25.8 low of Oct 23. Momentum is weak and rolling over again after the relief bounce. [Bearish]
- 20 EMA: The 21 EMA is $67.07, about 22% above price and falling steeply. Price has stayed below it since mid-October, so it acts as dynamic resistance. The EMA21 is also well below the EMA55 ($77.06), a bearish stack. [Bearish]
- MACD: The line is -7.23 and the signal is -6.77, so the line sits below the signal. The histogram is slightly negative (about -0.46) after shrinking from about -2.25 on Oct 26, and it is starting to widen again. The bounce failed to produce a bullish crossover. [Bearish]
- Bollinger Bands (20): Upper band is $93.12 and lower band is $44.41. The bands are wide, which reflects the volatility expansion. Price at $54.87 sits in the lower quarter (%B ≈ 0.21) and is not yet at the lower band, so there is room for further downside. [Bearish]
- CMF (20): -0.034 is in the neutral zone (between -0.05 and +0.05). It has flattened after a series of readings near -0.10 to -0.16, so selling pressure is easing but buyers have not taken control. [Neutral]
- ADX (14): 33.7 and rising from 11 on Oct 12, with −DI at 35.2 well above +DI at 13.5. This is a strong, established downtrend with bears firmly in control. [Strong Trend – Bearish]
- Volume: 53.51M is well above the pre-October average. The huge red-bar spike in mid-October was a capitulation-style breakdown. The bounce to $63.93 came on fading volume, and the new decline is again on elevated volume. [Bearish – distribution/active selling]
DIVERGENCES & TRENDS
- Mild bullish RSI divergence: Price at $54.87 is roughly equal to the Oct 23 low of $54.23, but RSI is 33.4 versus 25.8. This is a hint of selling exhaustion, not a confirmed reversal.
- MA structure: Price is below the EMA21 ($67.07), EMA55 ($77.06), SMA50 ($79.45), SMA200 ($91.35) and VWAP ($85.26). The SMA50 is already below the SMA200 (death cross in place), and every average is sloping down. The long-term trend is firmly bearish.
- MACD: The line has stayed below the signal throughout the decline. The brief narrowing of the gap during the Oct 27-29 bounce has reversed. This is a bearish continuation signal rather than a bullish cross.
- ADX/DI: −DI has been above +DI throughout, and ADX crossing above 25 confirms trend strength. No bullish DI crossover is in sight.
- Failed bounce: The rally from $54.23 to $63.93 (Oct 28) was rejected well below the EMA21 and has now retraced almost entirely. This is a lower high in a larger downtrend.
- CMF: Selling pressure has faded from the -0.10 to -0.16 range to about -0.03. This slightly tempers the bearish read but shows no accumulation.
CHART PATTERNS
- Bearish flag/descending channel after a sharp drop: The collapse from about $80 to $54 followed by a weak, low-volume bounce to $64 resembles a Bearish Flag/Pennant continuation. The measured move from the flagpole points to roughly $45-50 on a break of $54.
- Possible Bullish Double Bottom (unconfirmed): The lows at $54.23 (Oct 23) and about $54.87 (now) form a double-bottom candidate. It needs a close above the interim high near $63.93 to confirm, and a break below $54 invalidates it and turns it into a continuation breakdown.
- Larger structure: The decline since the June highs is a persistent lower-high, lower-low trend, with no sign of a Head and Shoulders or other reversal formation completing.
POTENTIAL SCENARIOS
- Scenario 1: Bearish Trend Continuation — The bear flag resolves lower, price loses the $54.23 swing low and slides toward the $50 area as ADX stays above 30 and −DI dominates. Trigger: daily close below $54.23 on elevated volume. Target: $50-51, with an extension toward the lower Bollinger Band at about $44.41. Invalidation: daily close above $63.93. (55% probability)
- Scenario 2: Bullish Oversold Relief Bounce / Double Bottom — RSI divergence and a hold above $54 lead to a rebound toward the falling EMA21, a bounce that would still sit within the larger downtrend. Trigger: a close above $59.57-$63.93 with a MACD histogram turn positive. Target: $63.93, then the EMA21 at about $67. Invalidation: close below $54.23. (30% probability)
- Scenario 3: Neutral Choppy Basing — Price stays between $50 and $60 as selling exhaustion offsets the bearish trend. Trigger: low-volume, overlapping candles with ADX peaking. Target: $52-58. Invalidation: a decisive close outside $50-$64. (15% probability)
PRICE TARGETS
- Target Price: $51.00 (34-day horizon)
- Expected Range: $47.20 to $57.00 (width $9.80 ≈ 17.9% of current price)
- Key Levels: Support at $54.23 (Oct 23 swing low; below that, $50.22 and the lower Bollinger Band at $44.41), Resistance at $63.93 (Oct 28 high; the EMA21 at $67.07 sits above)
OVERALL BIAS
OVERALL BIAS: BEARISH - Price is below every moving average with a death cross in place, ADX at 33.7 with −DI dominant, MACD below its signal, and the bounce failed under resistance on heavy volume. The mild RSI divergence and neutral CMF argue for volatility and a possible relief rally, but the weight of the evidence favors a retest and break of the $54 lows.
This is educational analysis and not financial advice.