PLTR 34-day bearish forecast — Nov 1, 2026
- Bias: Bearish
- Timeframe: 34 days (made Nov 1, 2026, target date Dec 4, 2026)
- Price at analysis: $184.11
- Price target: $177.00
- Expected range: $163.00 – $192.00
- Result: Pending — graded after the close on Dec 4, 2026
Get a free AI analysis of PLTR today
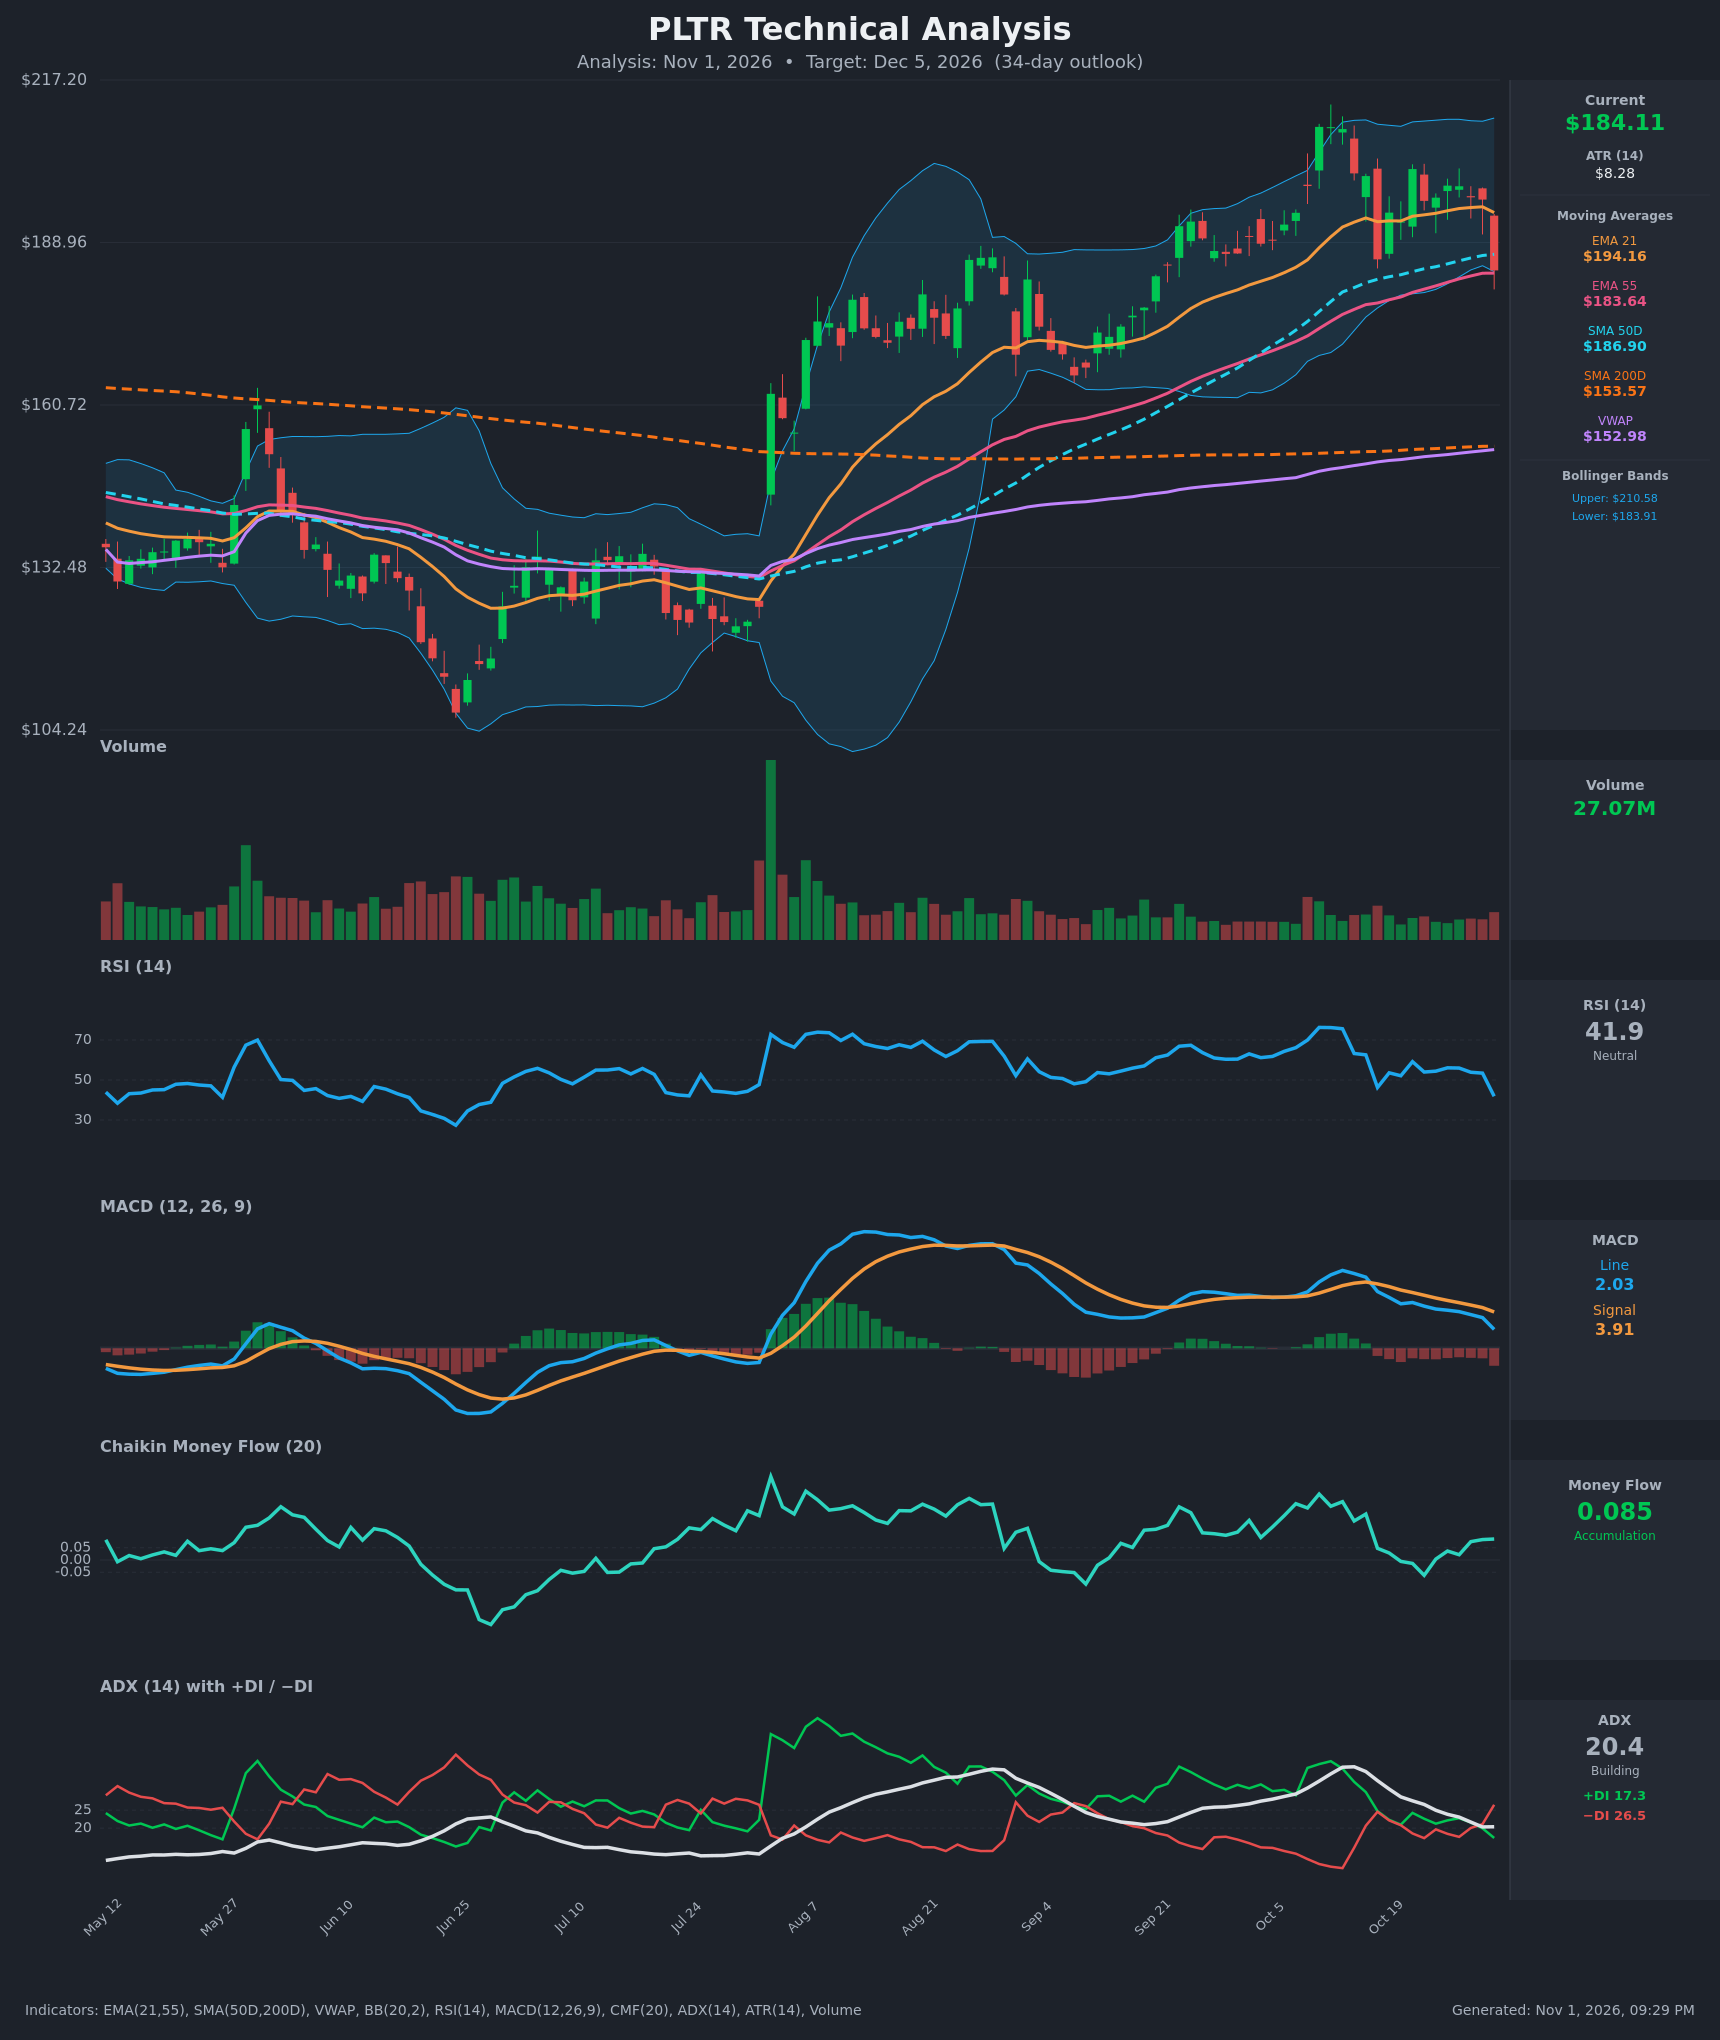
Analysis
TECHNICAL INDICATORS
- RSI (14): 41.86, down sharply from 53.4 the previous day and from 76 on Oct 12. It is below the 50 midline and falling, but not yet near oversold (30), so there is room to fall further. [Bearish]
- 20 EMA: The supplied EMA 21 is $194.16, and price at $184.11 is about 5% below it. The EMA has just started to roll over, so it now acts as overhead resistance. [Bearish]
- MACD: Line 2.03 vs signal 3.91. The line crossed below the signal around Oct 16 and the gap is widening, with a negative and expanding histogram. Momentum has been fading since mid-October. [Bearish]
- Bollinger Bands (20): Upper $210.58, lower $183.91. Price closed at $184.11, essentially on the lower band after a -6.3% day. This is a stretched move that could produce a bounce, but a close below the band would signal a breakdown with band-walking potential. The bands are wide, which reflects the volatility of the prior advance. [Neutral]
- CMF (20): 0.085, above the +0.05 threshold. It is slightly positive despite the price drop, so the selling is not yet showing up as distribution. This is the main bullish counterpoint. [Accumulation]
- ADX (14): 20.4 with −DI (26.5) above +DI (17.3). The −DI/+DI crossover happened on the latest bar, and the trend strength is weak and just turning up from the low 20s. This is an early bearish trend signal, not a confirmed one. [Weak Trend + Bearish direction]
- Volume: 27.07M on the latest red candle. This is average to slightly above average and not a capitulation spike, but it confirms the selling pressure on the drop. [Mildly Bearish]
DIVERGENCES & TRENDS
- Price vs RSI/MACD: Price made a higher high at around $209–$216 in mid-October, then RSI and MACD peaked and declined. MACD histogram peaked on Oct 13 (7.9 line) and is now at 2.03, a clear loss of momentum.
- CMF divergence: CMF is still positive (0.085) while price breaks lower, a mild bullish divergence. It has not turned negative, so buyers have not fully left.
- MA structure: Price is below EMA 21 and SMA50D ($186.90), and sits right at EMA55 ($183.64). EMA21 is still above EMA55, SMA50D is above SMA200D ($153.57), and price is above SMA200D and VWAP ($152.98). The long-term trend is intact, but the medium-term trend is weakening.
- Crossovers: MACD has crossed bearishly. The DI cross is bearish (−DI is now on top). There is no death cross and no EMA21/EMA55 cross.
- Key cluster: Price sits on the support confluence of the lower BB ($183.91), EMA55 ($183.64) and SMA50D ($186.90). A decisive close below it is the critical trigger.
CHART PATTERNS
- Bearish Double Top: Peaks around $208–$209 (Oct 12–13) after the earlier higher peak, with a neckline around $184–$186 (the Oct 16 low of $186.03 and today's low). A neckline break projects roughly a $23 measured move, to about $161–$163.
- Descending Triangle (bearish continuation/reversal): Lower highs ($201.7, $198.8, $196.8) press into flat support near $184–$186. A break lower targets the same $160s zone.
- Counter-case: The long-term uptrend above the rising SMA200D and the positive CMF mean a hold of the $184 cluster could instead produce a bounce back into the range. A reclaim of $194–$198 would negate the bearish structure.
POTENTIAL SCENARIOS
- Scenario 1: Bearish Support Breakdown — Price closes below the $183.6–$184 confluence (EMA55 / lower BB) and the weakening MACD and DI cross pull it lower toward the old breakout zone. Trigger: daily close below $183.60, ideally on volume above 30M. Target: $170, then $163 (double-top measured move). Invalidation: daily close back above $194 (EMA21). (50% probability)
- Scenario 2: Bullish Support Hold and Rebound — Positive CMF and the long-term uptrend let the cluster hold, and price mean-reverts from the lower band back toward the mid-range. Trigger: strong close back above $188–$190 (SMA50D). Target: $196–$200, with a stretch to $205. Invalidation: close below $180. (35% probability)
- Scenario 3: Neutral Range Chop — Price oscillates between $175 and $195 with ADX staying near 20. Trigger: repeated holds of $180 with failures near $195. Target: $182–$188. Invalidation: close outside $172–$198. (15% probability)
PRICE TARGETS
- Target Price: $177.00 (34-day horizon)
- Expected Range: $163.00 to $192.00 (width $29, about 15.8% of current price, consistent with the 30–60 day guidance)
- Key Levels: Support at $170.00 (immediate support at the $183.64 EMA55 / $183.91 lower BB cluster), Resistance at $194.16 (EMA21)
OVERALL BIAS
OVERALL BIAS: BEARISH - A bearish MACD crossover, falling RSI, −DI taking control, price below the 21 EMA with a double-top/descending-triangle structure, and price sitting on the key support cluster, whose break projects toward the $160s–$170s. Positive CMF and the position above the SMA200D temper conviction.
This is educational analysis and not financial advice.