RKLB 34-day bearish forecast — Nov 1, 2026
- Bias: Bearish
- Timeframe: 34 days (made Nov 1, 2026, target date Dec 4, 2026)
- Price at analysis: $54.73
- Price target: $51.50
- Expected range: $44.00 – $60.50
- Result: Pending — graded after the close on Dec 4, 2026
Get a free AI analysis of RKLB today
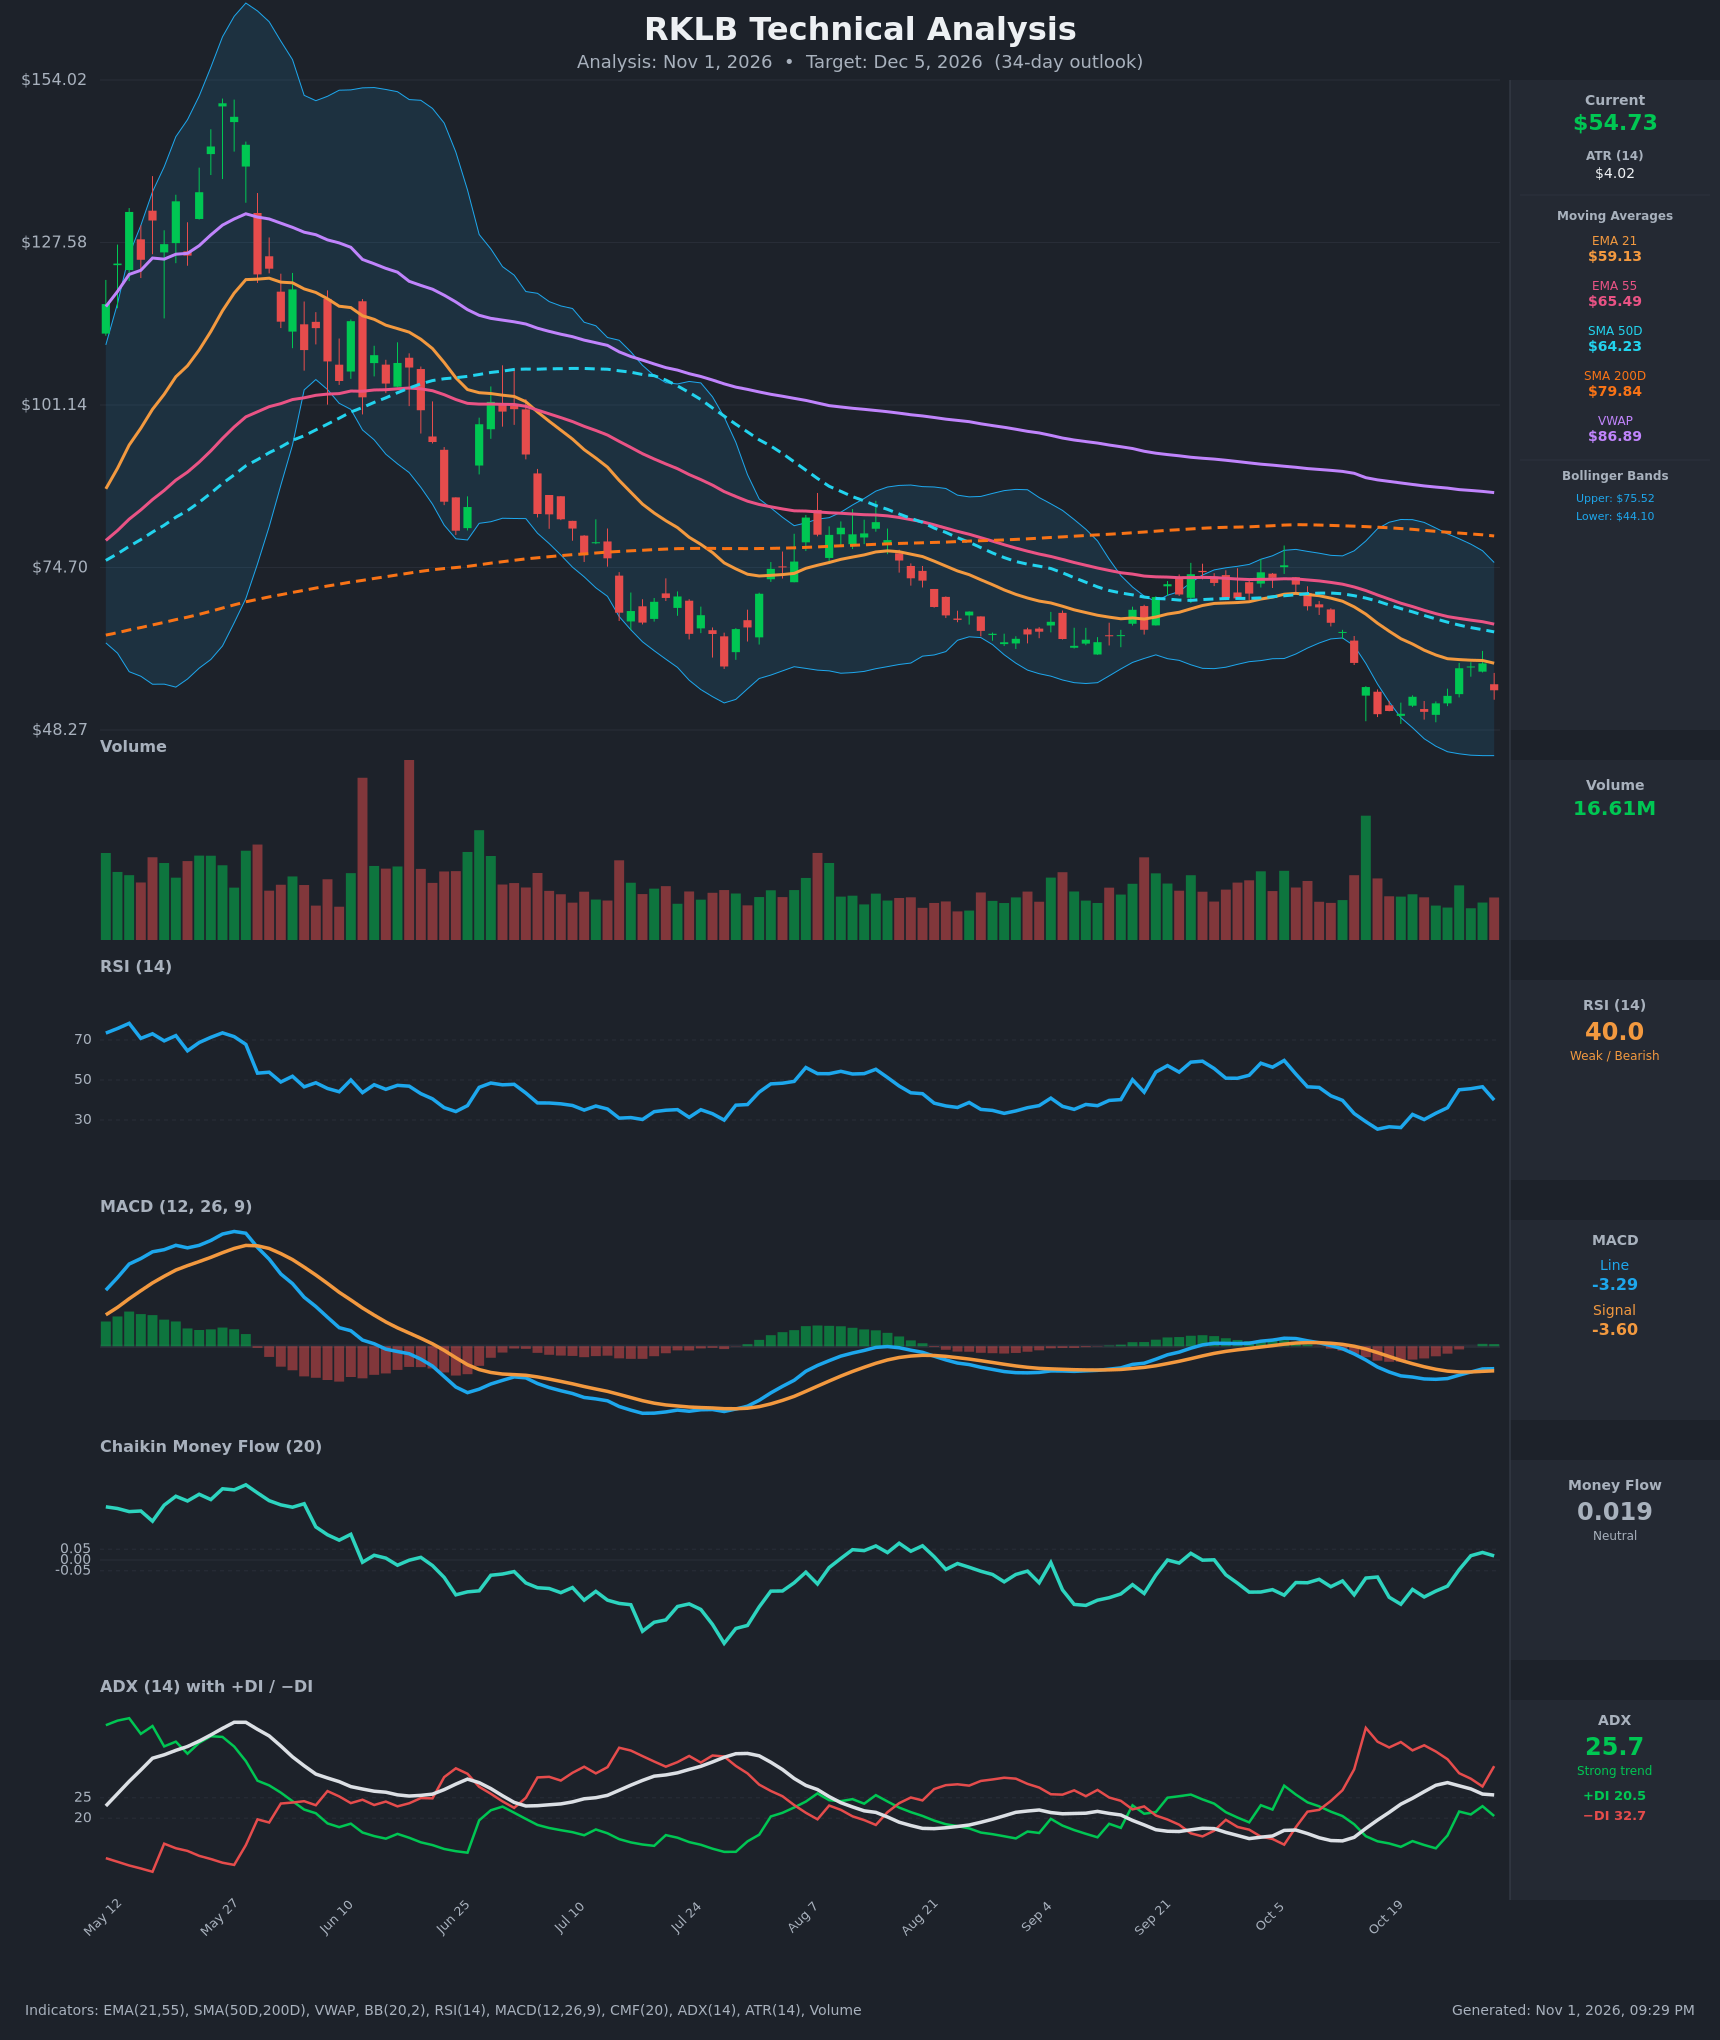
Analysis
TECHNICAL INDICATORS
- RSI (14): 39.96, rolling over from 46.6 on Oct 29 after bouncing from an oversold 25.4 low on Oct 16. It is below 50 and falling again, so momentum is weak but not oversold. [Bearish]
- 20 EMA: The 21 EMA is $59.13 and price at $54.73 is below it, so it acts as resistance. The EMA21 sits below the EMA55 ($65.49), and the gap is wide. Price was rejected right at the EMA21 on Oct 29-30. [Bearish]
- MACD: The line is -3.29 and the signal is -3.60, so the line is marginally above the signal. The histogram is slightly positive (+0.31) and rising, a mild bullish crossover that formed around Oct 28-29. Both lines are deep below zero, so this is only a relief bounce within a downtrend. [Neutral]
- Bollinger Bands (20): Upper is $75.52, lower is $44.10, and the midline is about $59.8. Price at $54.73 is in the lower half after bouncing off the lower band area in mid-October. The bands are wide, showing elevated volatility, and the midline is overhead resistance. [Bearish]
- CMF (20): 0.019, between the ±0.05 thresholds. It recovered from -0.205 to slightly positive, which shows selling pressure has faded, but there is no real accumulation. [Neutral]
- ADX (14): 25.7 with −DI at 32.7 above +DI at 20.5. ADX is above 25, so the trend is strong, and the bears control it. ADX has peaked and is rolling over slightly (28.7 to 25.7), a sign the downtrend is maturing. [Strong Trend – Bearish]
- Volume: 16.61M on the latest bar, which is average to below average. The bounce from $50.90 to $59.10 came on modest volume, and the latest red bar shows renewed selling. There is no capitulation spike on the lows, so the bounce lacks conviction. [Neutral to Bearish]
DIVERGENCES & TRENDS
- Price made lower closes ($50.84 on Oct 16, $50.90 on Oct 20, $51.22 on Oct 22) while RSI printed 25.4, 26.2 and 30.2. Price chopped at the lows while RSI recovered, a mild bullish divergence that produced the bounce to $59.10.
- The bounce has stalled at the EMA21 (about $59) and RSI has rolled over from 46.6 to 40.0. This is a failed reclaim of the short-term average.
- A death cross has already occurred: SMA50D ($64.23) is far below SMA200D ($79.84). Price is below all moving averages, and VWAP ($86.89) is far overhead. The long-term downtrend is intact.
- The MACD bullish crossover is weak because it happened deep in negative territory. The histogram is likely to flatten or turn negative again if price keeps falling.
- DI lines: −DI has been above +DI since Oct 12. +DI briefly rose to 22.9 but is now falling back to 20.5 while −DI is rebuilding (27.8 to 32.7).
- The EMA21 is converging toward the SMA50D and will keep falling. The EMA stack is bearish (21 < 55 < SMA50D < SMA200D).
CHART PATTERNS
- Bearish Flag / Rising Wedge-style relief bounce: After the sharp drop from $65 to $51 in Oct 12-20, the rebound to $59 on lower volume looks like a corrective bounce. A rejection at the EMA21 supports a continuation lower. The flag-based measured move (the ~$14 pole) projects toward the mid-$40s.
- Broader context: Since the May peak (~$150), the stock has made a long series of lower highs and lower lows, a large descending channel. There is a possible basing attempt around $50 (a double-bottom-like low at $50.84-$50.90), but the neckline near $59-60 has not been reclaimed. A break above $59-60 would make a bullish double bottom, with a target of about $68.
- Support: The $50-51 double-low zone is key. A break of it projects toward the lower Bollinger Band at about $44.
POTENTIAL SCENARIOS
- Scenario 1: Bearish Retest and Breakdown — The relief bounce failed at the EMA21 and the downtrend resumes, with −DI dominant and every moving average sloping down. Trigger: close below $52 and then below the $50.50 double-low. Target: $46-47, with a possible extension to the $44 lower band. Invalidation: daily close above $60. (50% probability)
- Scenario 2: Neutral Range-Bound Basing — Price consolidates between the $50 double-bottom support and the $59-60 EMA21 resistance as volatility compresses and ADX fades. Trigger: holds $50.50 and fails at $59-60. Target: $51-58. Invalidation: close outside the $49.50-$61 range. (20% probability)
- Scenario 3: Bullish Double-Bottom Breakout — The double bottom near $50.90 plays out, MACD stays above signal, and CMF turns above +0.05, so price reclaims the EMA21. Trigger: close above $60 on rising volume. Target: $65-68 (EMA55 and SMA50D). Invalidation: close back below $54 after the breakout. (30% probability)
PRICE TARGETS
- Target Price: $51.50 (34-day, mildly bearish, slightly above the $50 double-low as bounce attempts are likely)
- Expected Range: $44.00 to $60.50 (width $16.50, about 30% of the current price; a bit wider than the 12-18% guide because ATR is $4.02, or about 7% a day, and this is a high-volatility name)
- Key Levels: Support at $50.50, Resistance at $59.10
OVERALL BIAS
OVERALL BIAS: BEARISH - Price is below every moving average with a death cross in place, −DI at 32.7 versus +DI at 20.5 with ADX above 25, and the bounce was rejected at the EMA21 while RSI rolled over. The weak MACD crossover and neutral CMF offer only limited counter-evidence, so the risk favors a retest of the $50 lows.
This is educational analysis and not financial advice.