SOFI 34-day bullish forecast — Nov 1, 2026
- Bias: Bullish
- Timeframe: 34 days (made Nov 1, 2026, target date Dec 4, 2026)
- Price at analysis: $16.76
- Price target: $17.60
- Expected range: $15.60 – $18.00
- Result: Pending — graded after the close on Dec 4, 2026
Get a free AI analysis of SOFI today
Analysis
TECHNICAL INDICATORS
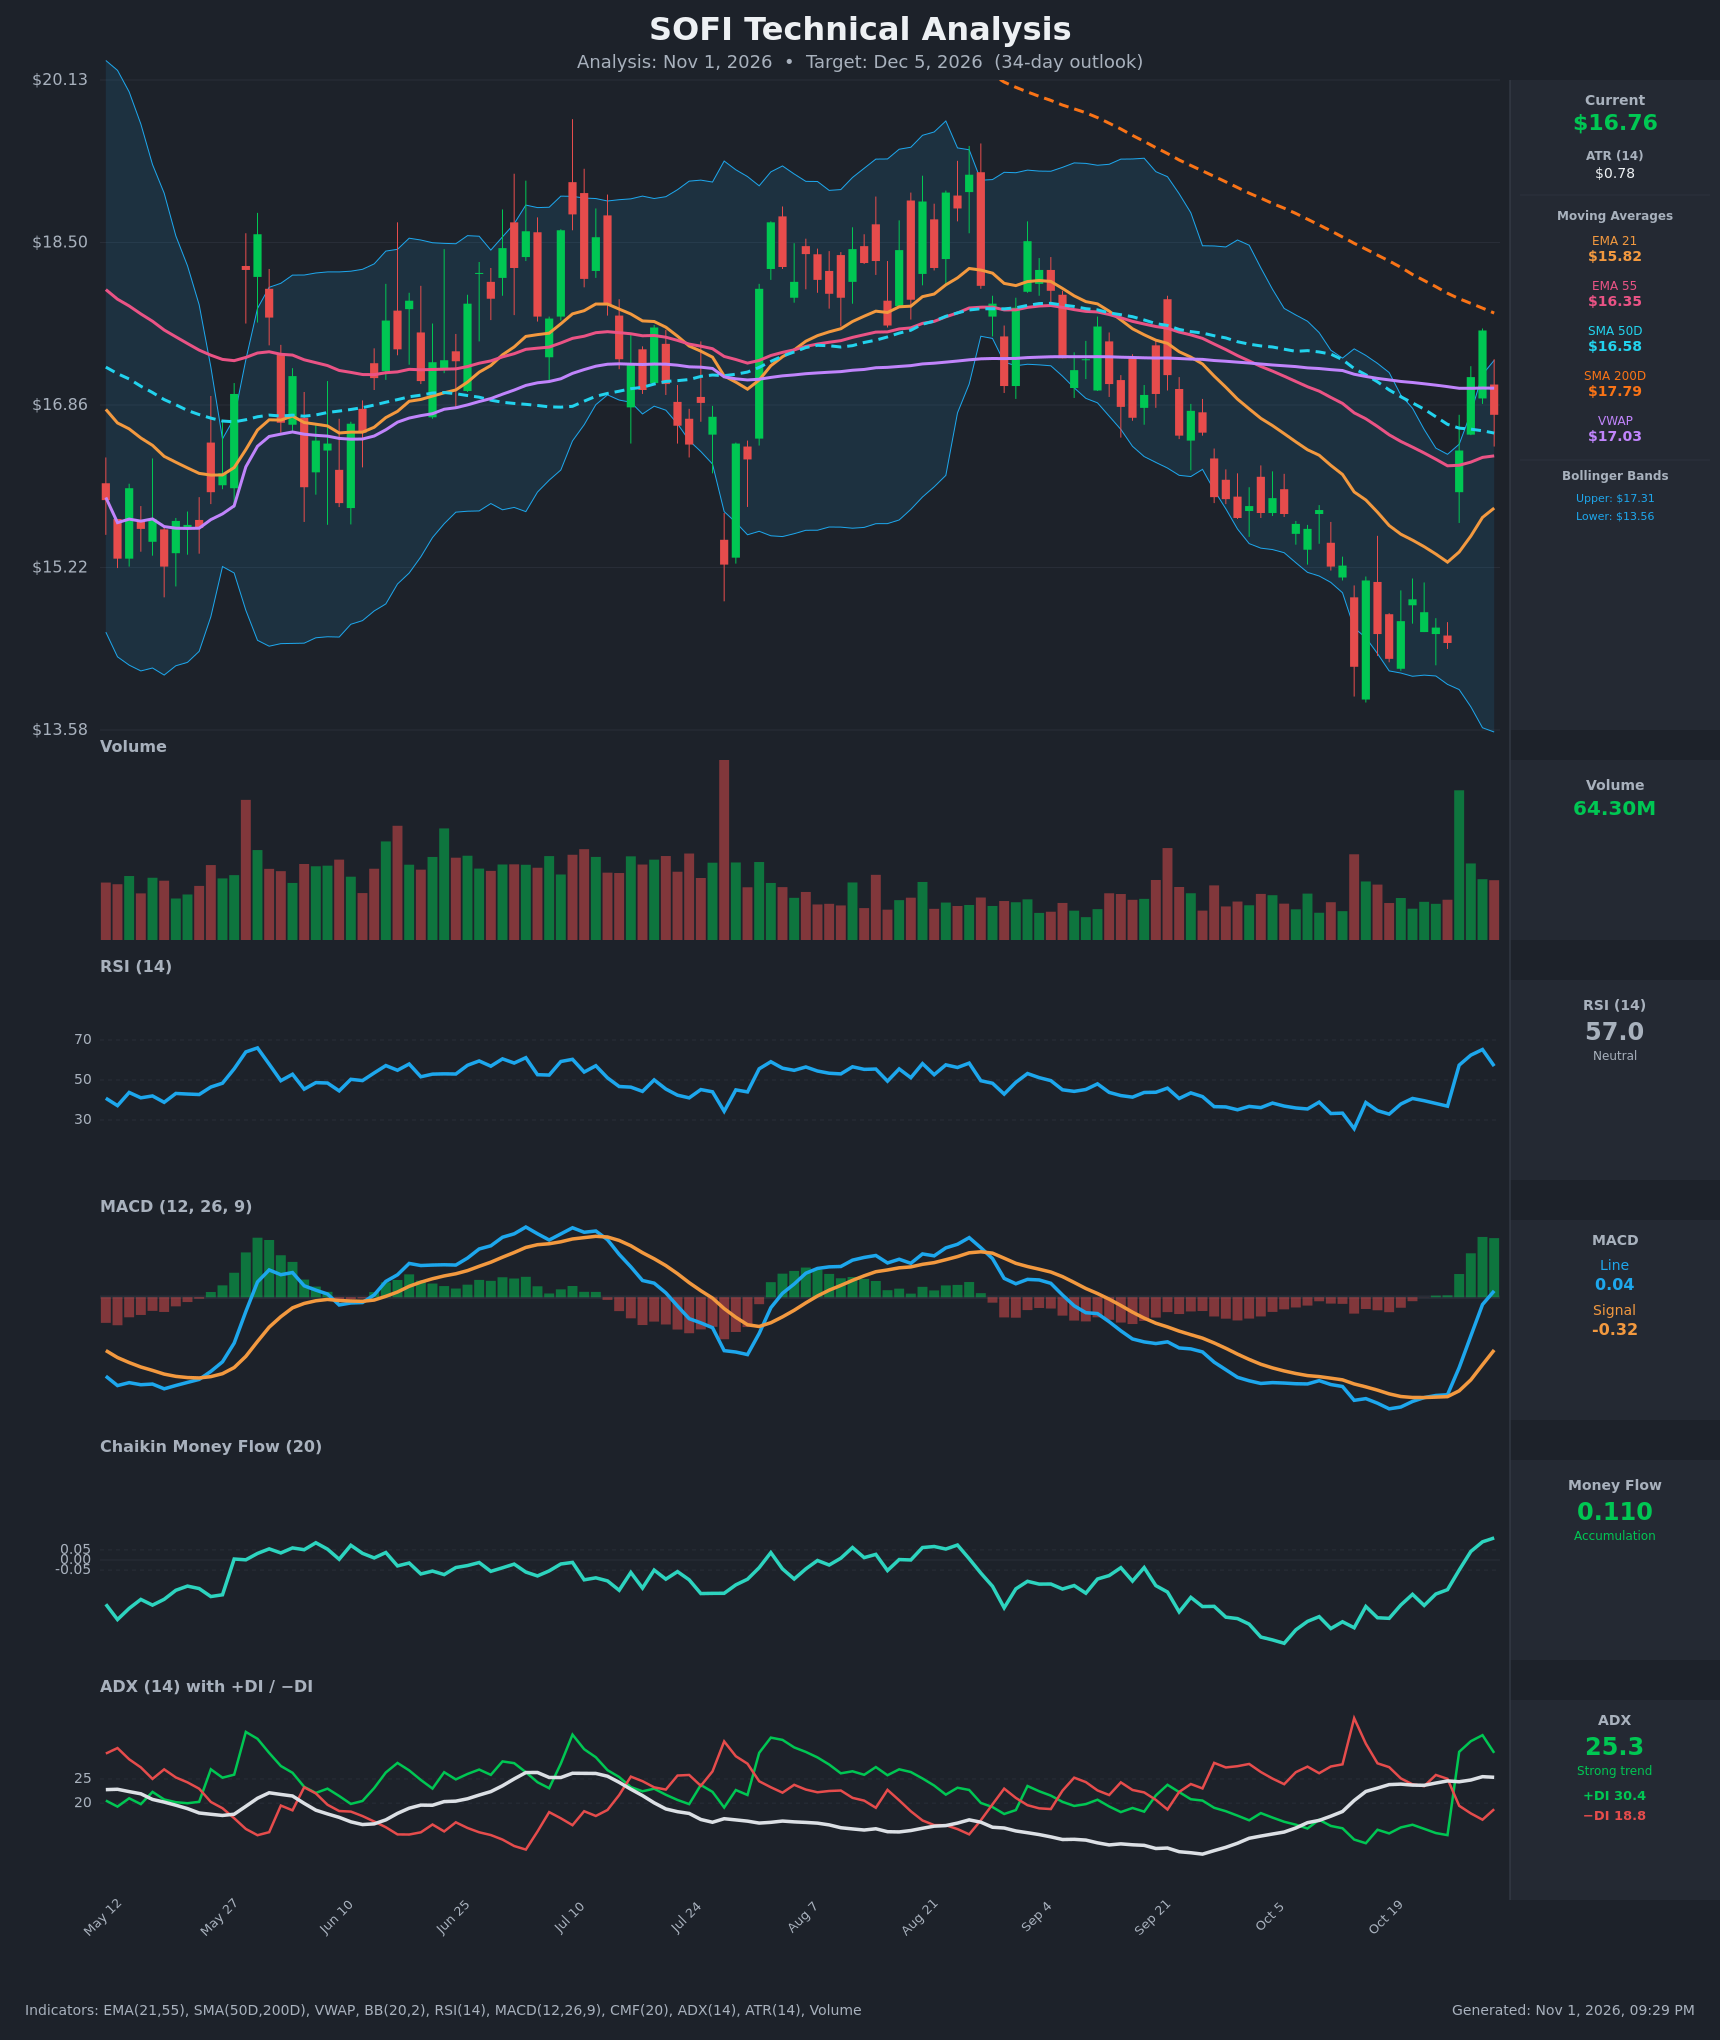
- RSI (14): 56.97, down from a 65.2 peak on Oct 29 but well above the 25-37 oversold zone it sat in two weeks ago. It has rebuilt from oversold to the mid-50s, so momentum has shifted up with room before 70. [Bullish]
- 20 EMA: The 21 EMA is $15.82 and rising (about $15.27 on Oct 26). Price at $16.76 is about 6% above it, and the EMA acts as dynamic support. The EMA21 is still below the EMA55 ($16.35), so no bullish EMA crossover has happened yet, but the gap is closing. [Bullish]
- MACD: The line (0.038) crossed above the signal (-0.322) on Oct 30, a fresh bullish crossover from deeply negative territory. The histogram is strongly positive and expanding. The line has also just crossed zero. [Bullish]
- Bollinger Bands (20): The bands run from $13.56 to $17.31, with the middle band near $15.4. Price is in the upper half of the bands, about $0.55 below the upper band. The bands are wide after the recent selloff and spike, and a pullback toward the mid-band is possible. [Neutral]
- CMF (20): 0.110, above the +0.05 threshold and rising since Oct 28 (-0.05 → 0.042 → 0.090 → 0.110). It has gone from sustained distribution to accumulation, which supports the rally. [Accumulation]
- ADX (14): 25.3, at the strong-trend threshold and flat to slightly rising. +DI (30.4) is above -DI (18.8) after a bullish DI crossover on Oct 27. The previous ADX readings reflected a bearish trend, and the direction has now flipped to bullish. [Strong Trend + Bullish]
- Volume: 64.30M on the latest bar, with a huge spike on the Oct 27 breakout bar and above-average volume since. The latest red candle (-4.8%) came on lower volume than the breakout, which looks like profit-taking rather than heavy distribution. [Bullish, with caution]
DIVERGENCES & TRENDS
- Trend shift: Price fell from about $19 in late Aug to $14.22 on Oct 14, then reversed sharply. It gained about $3.15 (+22%) from Oct 26 to Oct 29, then pulled back $0.85 on Oct 30.
- Momentum: The MACD bullish crossover, the DI flip (+DI 30.4 vs -DI 18.8) and CMF turning positive all confirm the bounce. No bearish divergence is visible, and the last price high ($17.61) came with a matching RSI peak.
- Moving averages: Price has reclaimed the EMA21, EMA55 (16.35) and SMA50D (16.58). It remains below VWAP ($17.03) and SMA200D ($17.79). The SMA50D is already below the SMA200D (death cross in effect), so the longer-term trend is still bearish until the SMA200 is retaken.
- Overhead resistance: The descending dashed trendline and SMA200D sit near $17.7-$17.8. Bears will defend this confluence zone.
- Red flag: The Oct 30 pullback shows sellers are active near $17.60, and today's close is below VWAP.
CHART PATTERNS
- Bullish Falling Wedge / downtrend reversal: Price made lower highs and lower lows from Aug to Oct inside a descending channel and then broke out sharply. The measured target is a retracement toward the wedge origin ($18-$19), but the overhead SMA200/trendline will likely cap the first leg.
- Bullish Flag / Pennant (developing): The sharp rally from $14.46 to $17.61 followed by a shallow pullback resembles a bullish flag. A hold above $16.35-$16.58 and a break above $17.61 would project roughly $19, though a 34-day horizon likely captures only part of that.
- Caution: The failure at the descending trendline would invalidate the flag and turn the bounce into a dead-cat bounce within the larger downtrend.
POTENTIAL SCENARIOS
- Scenario 1: Bullish Breakout Continuation — Price consolidates above the SMA50 and EMA55 (the $16.35-$16.58 zone), then pushes through the VWAP and the $17.61 swing high. Momentum (MACD, CMF, +DI) supports a test of the SMA200 and the descending trendline. Trigger: daily close above $17.61 on volume. Target: $18.30-$18.80. Invalidation: daily close below $16.00. (50% probability)
- Scenario 2: Neutral Range-Bound Consolidation — Price chops between the $16.35 support and the $17.60-$17.80 resistance cluster as the SMA200 and trendline cap rallies. Trigger: repeated rejections at $17.60-$17.80 with holds above $16.35. Target: $16.40-$17.40. Invalidation: close above $17.80 or below $16.00. (20% probability)
- Scenario 3: Bearish Failed Bounce — The rally proves a dead-cat bounce within the larger downtrend, rejected at the trendline and SMA200. Price loses the SMA50 and EMA55, then retests the EMA21 and the lower range. Trigger: daily close below $16.35. Target: $15.20-$14.80. Invalidation: close above $17.80. (30% probability)
PRICE TARGETS
- Target Price: $17.60 (34-day, about +5.0% from $16.76)
- Expected Range: $15.60 to $18.00 (width $2.40, about 14.3% of current price, consistent with the 30-60 day guidance of 12-18%)
- Key Levels: Support at $16.35 (EMA55, with the SMA50 at $16.58 just above it), Resistance at $17.61 (Oct 29 high; minor hurdles at VWAP $17.03 and the SMA200 at $17.79)
OVERALL BIAS
OVERALL BIAS: BULLISH - The MACD bullish crossover, the +DI/-DI flip with ADX at 25, and CMF turning to accumulation outweigh the still-bearish long-term structure, as price has reclaimed the EMA21, EMA55 and SMA50D. Conviction is moderate because the SMA200D and descending trendline overhead near $17.7-$17.8 are major resistance.
This is educational analysis and not financial advice.