SOXS 34-day bearish forecast — Nov 1, 2026
- Bias: Bearish
- Timeframe: 34 days (made Nov 1, 2026, target date Dec 4, 2026)
- Price at analysis: $52.08
- Price target: $47.50
- Expected range: $42.00 – $51.50
- Result: Pending — graded after the close on Dec 4, 2026
Get a free AI analysis of SOXS today
Analysis
TECHNICAL INDICATORS
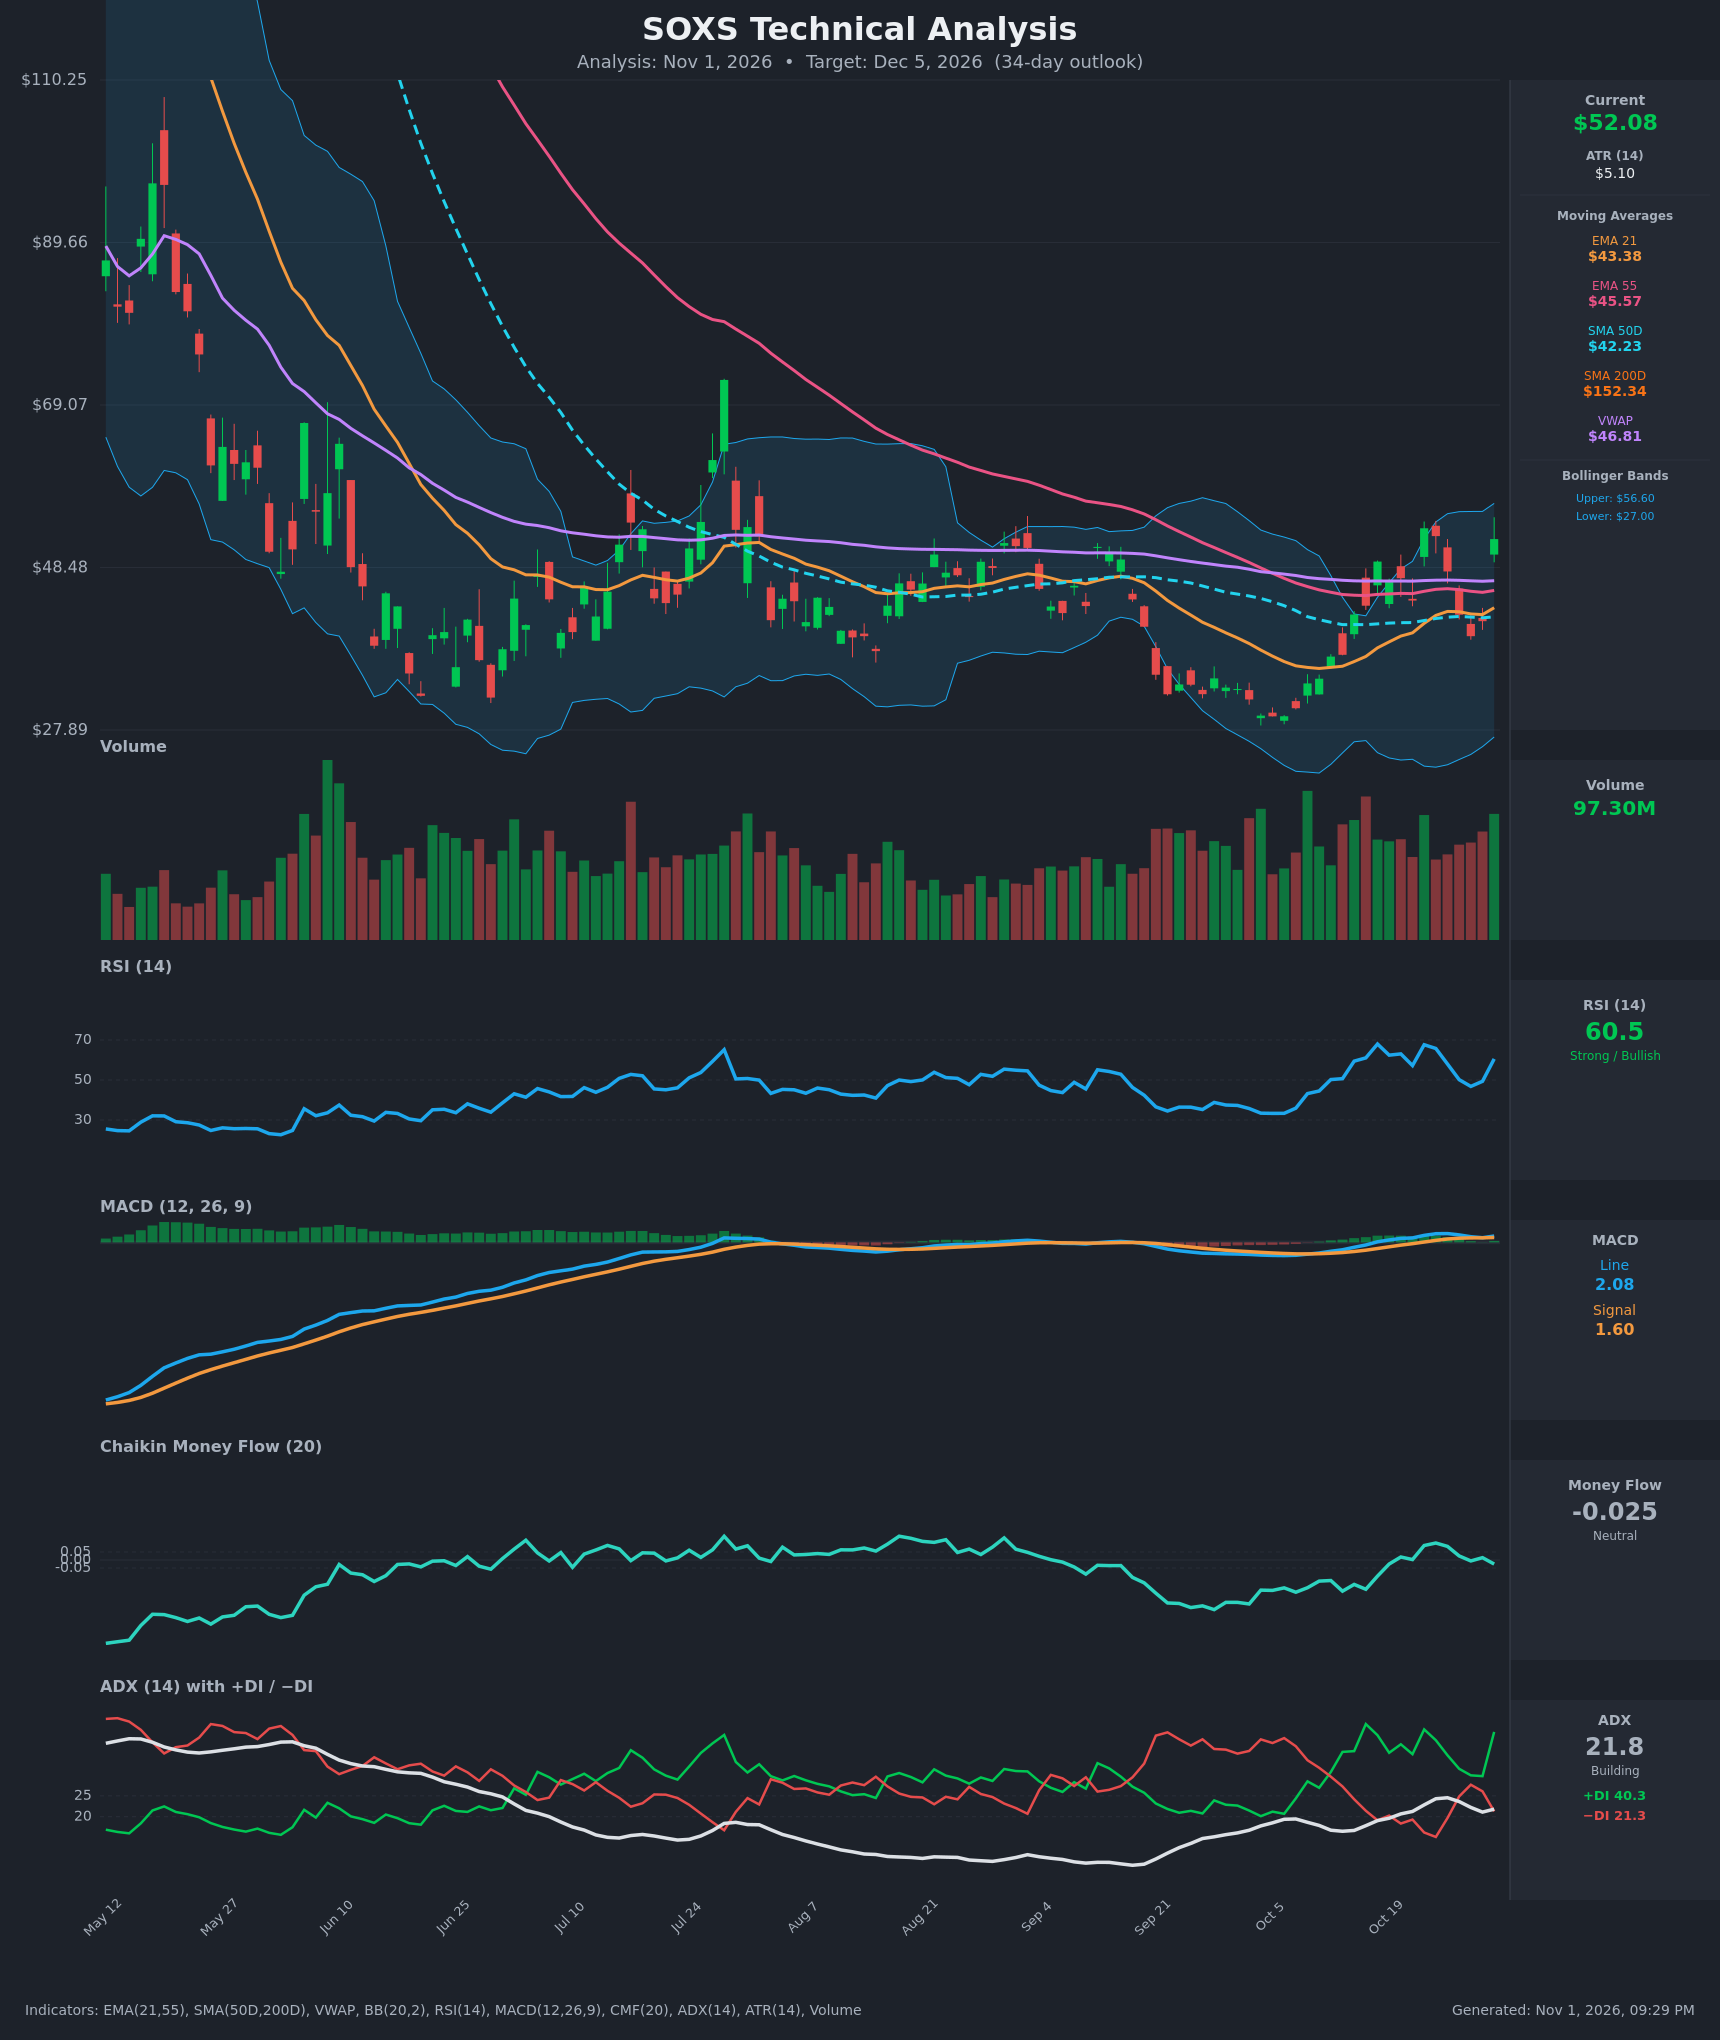
- RSI (14): 60.55, up from 49.4 two sessions ago. It is in bullish territory but not overbought. Recent peaks (68.0 on Oct 16, 67.6 on Oct 22) were followed by sharp pullbacks, so ~65-68 has acted as a ceiling. [Bullish]
- 20 EMA (EMA 21: $43.38): Price at $52.08 is about 20% above it, and the EMA is rising. This is supportive, but price is stretched far from the mean, which raises mean-reversion risk. EMA 21 ($43.38) is still below EMA 55 ($45.57), so no bullish EMA crossover has completed. [Bullish]
- MACD: Line 2.084 is above Signal 1.604 (a bullish crossover on Oct 16-22), with a positive, mildly rising histogram. The line is sitting just below its Oct 26 high of 2.886, so momentum is positive but not accelerating. [Bullish]
- Bollinger Bands (20): Upper $56.60, lower $27.00. The bands are very wide, reflecting extreme volatility. Price is in the upper third, about $4.5 below the upper band. The mid-band is roughly $41.8. After the last upper-half thrust ($53.45), price fell 26% in four sessions. [Neutral]
- CMF (20): -0.025, inside the ±0.05 neutral band. It has faded from +0.106 on Oct 23 despite higher prices, so buying pressure is not confirming the rally. [Neutral]
- ADX (14): 21.8, with +DI 40.3 above −DI 21.3. Bulls are in control, but ADX is barely above 20, so the trend is weak and just emerging. The DI spread is wide, yet the ADX has not confirmed it. [Weak Trend + Bullish direction]
- Volume: 97.30M, on the high side of the recent range, with a green bar on the Oct 30 spike. Volume has been elevated on both the up and down legs of the whipsaw, so there is no clean accumulation signal. [Neutral / Mildly Bullish]
Other levels:
- Price is above VWAP ($46.81), SMA 50D ($42.23) and EMA 55 ($45.57).
- Price is far below SMA 200D ($152.34), a long-term downtrend. This is partly an artifact of the decay and reverse-split adjustments of a 3x inverse ETF.
- The SMA 50D/200D death cross is long established.
DIVERGENCES & TRENDS
- CMF vs price: Price is making equal or higher highs ($53.45 → $52.08 area) while CMF has dropped from +0.106 to -0.025. This is a mild bearish divergence in money flow.
- RSI: Not making new highs versus the Oct 16 reading of 68, so there is no strong momentum confirmation at the $52-53 area.
- MACD: The bullish crossover is intact, but the line is flat to slightly lower than its Oct 26 peak.
- Higher lows: The Oct low (~$29) to the Oct 28 low ($39.78) shows a recovery sequence, a constructive sign.
- Whipsaw behaviour: Daily moves of 10-25% (e.g., $41.68 → $52.08, $44.29 → $53.45) have been repeatedly retraced within a few sessions.
- Trend: Price recently reclaimed EMA 21, EMA 55, SMA 50D and VWAP, but it is still capped by the $53 zone.
CHART PATTERNS
- Bearish Double Top (approximate): Peaks at $53.45 (Oct 22) and about $52 (Oct 30) with a trough near $39.78 between them. A neckline break below ~$39.8 would project a measured move toward ~$26-28. This is only partly formed, since price has not broken the neckline.
- Range / Base: Since July, price has traded roughly between $29 and $53 with a rising floor, which could be read as a base. A close above $53.5-56.6 would be a bullish breakout of that range.
- Bullish Falling Wedge / Inverted H&S: Not clearly visible. The Sep-Oct bottom suggests possible rounding, but it is unconfirmed.
- Net read: The double-top risk at resistance versus a base breakout is roughly balanced. Overextension from the means tips the 34-day edge slightly lower.
POTENTIAL SCENARIOS
- Scenario 1: Bearish Rejection at Double-Top Resistance — Price stalls at the $52-53.5 zone, as it did on Oct 22, and mean-reverts toward VWAP and EMA 55 as CMF stays flat or negative and ADX stays weak. Trigger: Daily close below $46.80 (VWAP) after a failure at $53.45. Target: $45.50 (EMA 55), extending to $42-43 (SMA 50D/EMA 21). Invalidation: Daily close above $56.60 (upper Bollinger Band). (50% probability)
- Scenario 2: Bullish Breakout of Range — +DI dominance and the MACD crossover pull ADX above 25, and price clears $53.45 on volume. Trigger: Close above $53.50 with CMF above +0.05. Target: $56.60, then $62-65. Invalidation: Close below $45.50. (35% probability)
- Scenario 3: Neutral Choppy Consolidation — Price oscillates between ~$44 and ~$53 as ADX stays near 20. Trigger: Repeated closes between $45 and $53. Target: $48-50 mid-range. Invalidation: Close outside $42-$56. (15% probability)
PRICE TARGETS
- Target Price: $47.50 (34-day)
- Expected Range: $42.00 to $51.50 (width $9.50, about 18.2% of current price, consistent with the 30-60 day guidance)
- Key Levels: Support at $46.80 (VWAP; then $45.57 EMA 55), Resistance at $53.45 (Oct 22 high; then $56.60 upper Bollinger Band)
OVERALL BIAS
OVERALL BIAS: BEARISH - Price is extended roughly 20% above EMA 21 and 11% above VWAP at a prior reversal zone ($52-53.5). CMF is fading and ADX is weak, so a mean-reversion pullback is the most likely outcome. Bullish MACD and DI readings keep a breakout scenario alive (35%), which is why conviction is modest.
This is educational analysis and not financial advice.