SOXL 34-day bearish forecast — Nov 1, 2026
- Bias: Bearish
- Timeframe: 34 days (made Nov 1, 2026, target date Dec 4, 2026)
- Price at analysis: $77.05
- Price target: $71.00
- Expected range: $64.00 – $78.00
- Result: Pending — graded after the close on Dec 4, 2026
Get a free AI analysis of SOXL today
Analysis
TECHNICAL INDICATORS
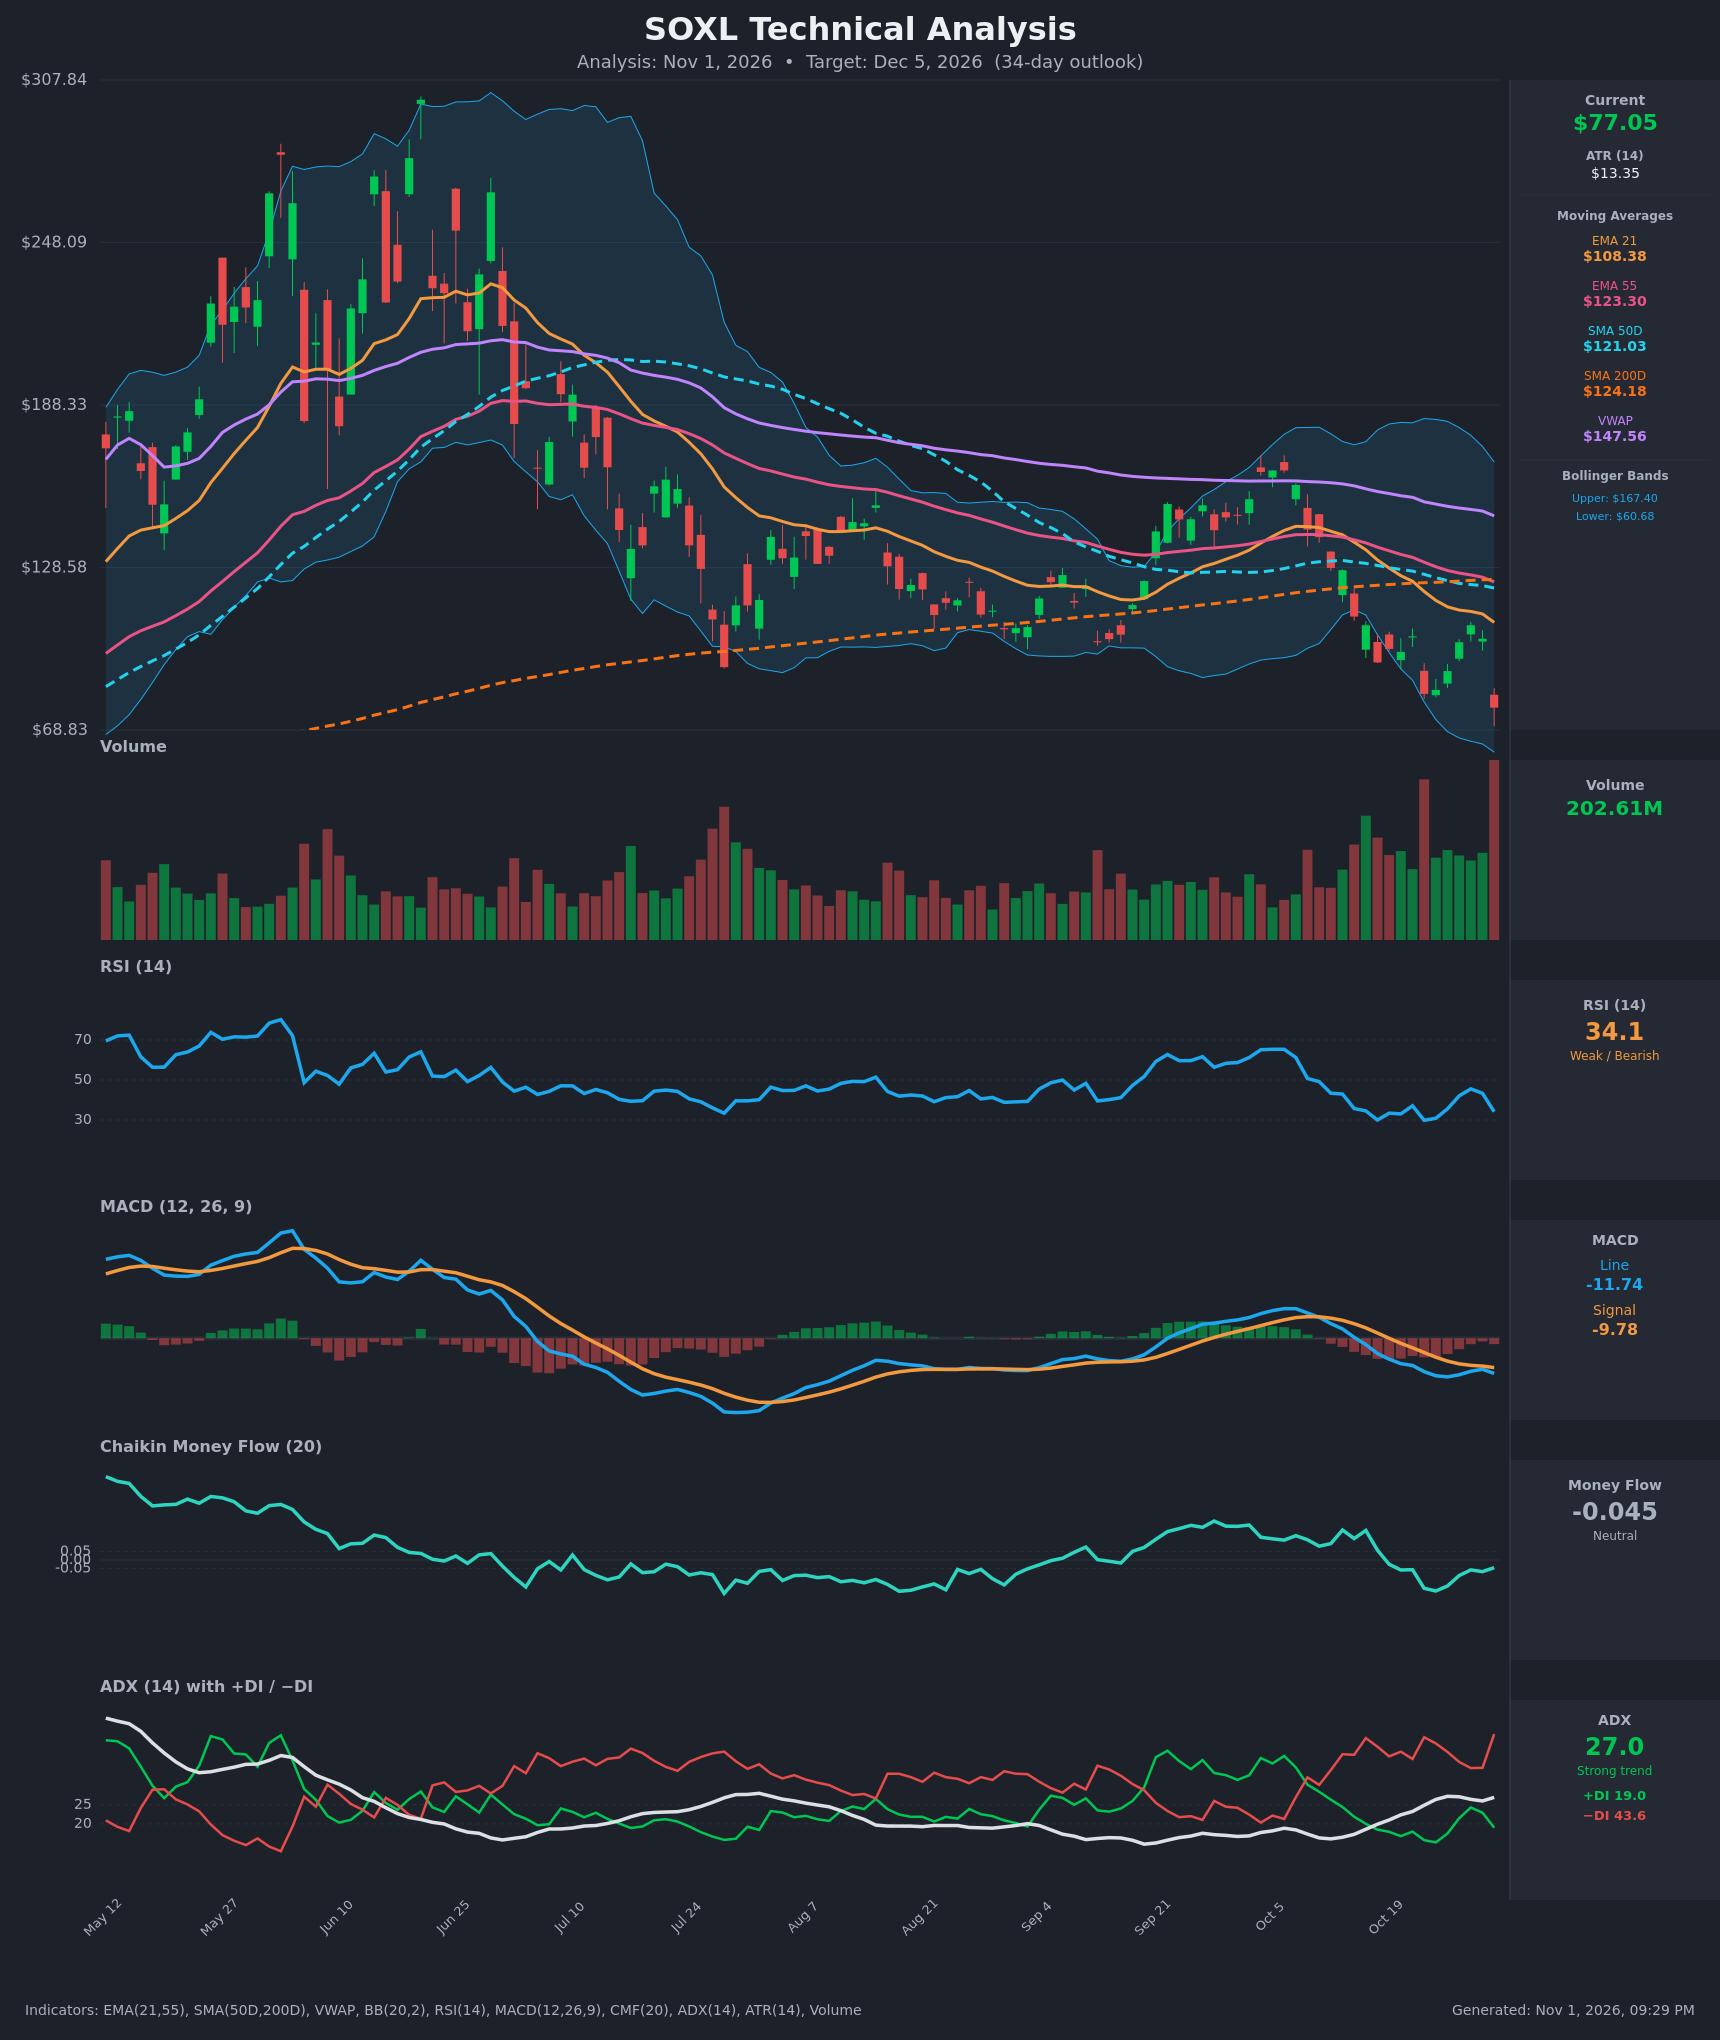
- RSI (14): 34.14, down from 43.3 the prior day and close to oversold. It has held 30-31 on the last two selloffs (Oct 16 at 30.0, Oct 22 at 29.9). Momentum is weak, but there is a mild higher-low versus the Oct 22 reading. [Bearish]
- 20 EMA (EMA 21 = $108.38): Price at $77.05 is about 29% below the EMA 21, which is now overhead resistance. It is also below EMA 55 ($123.30) and has been below it since Oct 14, a bearish crossover. [Bearish]
- MACD: Line -11.74 is below signal -9.78, so the histogram is about -1.95 and widening again after narrowing on Oct 28-29. The line has been below zero since Oct 15 and the pair is turning back down after a failed attempt to converge. [Bearish]
- Bollinger Bands (20): Upper $167.40, lower $60.68, so the bands are very wide, reflecting extreme volatility. Price sits in the lower third of the range, about $16 above the lower band. It has not touched the lower band, so there is room for more downside before a statistical stretch. The bands are starting to turn down, which is consistent with a trending move. [Bearish]
- CMF (20): -0.045 is technically neutral (inside ±0.05) but has been negative since Oct 19, ranging from -0.025 to -0.182. It is mildly improving from the -0.18 trough but still leans toward distribution. [Neutral]
- ADX (14): 27.0 and above 25, so the trend is strong. −DI (43.6) is far above +DI (19.0), giving bears clear control. ADX has risen from about 16 to 27 in three weeks, which confirms the downtrend is gaining strength. [Strong Trend – Bearish]
- Volume: 202.61M is the highest bar on the chart, on a roughly -25% day (from $102.39 to $77.05). That is heavy selling, consistent with either a capitulation flush or an accelerating breakdown. It is a decisive-breakdown candle with no confirmation yet of a bounce. [Bearish – possible capitulation]
DIVERGENCES & TRENDS
- Minor bullish RSI divergence: Price made a lower low ($77.05 vs $82.11 on Oct 22) while RSI is higher (34.1 vs 29.9). It is weak on its own and needs a bullish close to be confirmed.
- Death cross: SMA50D ($121.03) crossed below SMA200D ($124.18) around Oct 27, a major long-term bearish signal. EMA 21 crossed below EMA 55 around Oct 14.
- Price vs long-term averages: Price is far below SMA200D ($124.18), SMA50D, and VWAP ($147.56). The long-term trend is firmly down and every moving average is stacked above price.
- Pattern of lower highs: The rally into early October failed at about $165-170, near the upper band. The Oct 14 collapse then broke through all supports.
- DI trend: −DI has stayed above +DI the whole period, and +DI dropped back from 24.3 to 19.0 after the latest bounce failed.
- MACD/histogram: The earlier convergence toward the signal line failed, so the bearish momentum cross is reasserting.
- CMF: It improved slightly into the bounce (-0.058 to -0.045) but has not turned positive.
CHART PATTERNS
- Bearish flag / rising-wedge-style breakdown (continuation): The September to early-October rally formed a channel that broke down on Oct 14, in line with the reference diagram's bearish continuation patterns. A measured move extends the flagpole below the break, which supports lower targets, with the ATR-based zone at $60-65 and the lower Bollinger Band at $60.68.
- Failed support: The $82-100 zone, which was the prior base, has been lost. The Oct 22 low (~$82) was undercut on high volume.
- No bullish reversal pattern is confirmed. There is no double bottom, because the second low undercut the first. A bounce would only be a relief rally inside the downtrend, to be sold near the broken $90-$102 area.
POTENTIAL SCENARIOS
- Scenario 1: Bearish Trend Continuation — The −DI-dominant, strong-ADX trend continues, with the death cross, the MACD cross and the breakdown on record volume all pointing lower. Price grinds toward the lower Bollinger Band. Trigger: daily close below the $77 area / failure to reclaim $85. Target: $62-$68. Invalidation: daily close above $95-$100 (above the Oct 27-29 range and EMA 21 slope). (50% probability)
- Scenario 2: Bullish Capitulation Bounce — Record volume and RSI near 30 mark a flush, and a mean-reversion rally follows. Price retraces toward the broken $90-$102 zone before sellers return. Trigger: bullish reversal candle and RSI back above 40, with CMF turning positive. Target: $90-$100 (about $108 EMA 21 as the extension). Invalidation: loss of $65 on a closing basis. (30% probability)
- Scenario 3: Neutral Volatile Chop — Price oscillates between about $65 and $90 as sellers and dip buyers offset each other, ending close to current levels. Trigger: failed breakdown below $70 followed by repeated rejections at $88-$90. Target: $72-$82. Invalidation: close outside $62-$95. (20% probability)
PRICE TARGETS
For a 34-day horizon, the range width is calculated at 18.2% ($14.00 / $77.05), within the 12-18% guideline for 30-60 days.
- Target Price: $71.00 (below the current price, consistent with the bearish bias)
- Expected Range: $64.00 to $78.00
- Key Levels: Support at $60.68 (lower Bollinger Band), Resistance at $90.50 (Oct 26 close and broken support)
OVERALL BIAS
OVERALL BIAS: BEARISH - Price is below every moving average after a death cross, MACD is below its signal line and falling again, and ADX at 27 with −DI (43.6) far above +DI (19.0) confirms a strong downtrend. The oversold RSI and record-volume flush raise the chance of a bounce, so the target is modest at $71 and the $90 area should cap rallies.
This is educational analysis and not financial advice.