SPY 34-day bearish forecast — Nov 1, 2026
- Bias: Bearish
- Timeframe: 34 days (made Nov 1, 2026, target date Dec 4, 2026)
- Price at analysis: $755.72
- Price target: $744.00
- Expected range: $708.00 – $800.00
- Result: Pending — graded after the close on Dec 4, 2026
Get a free AI analysis of SPY today
Analysis
TECHNICAL INDICATORS
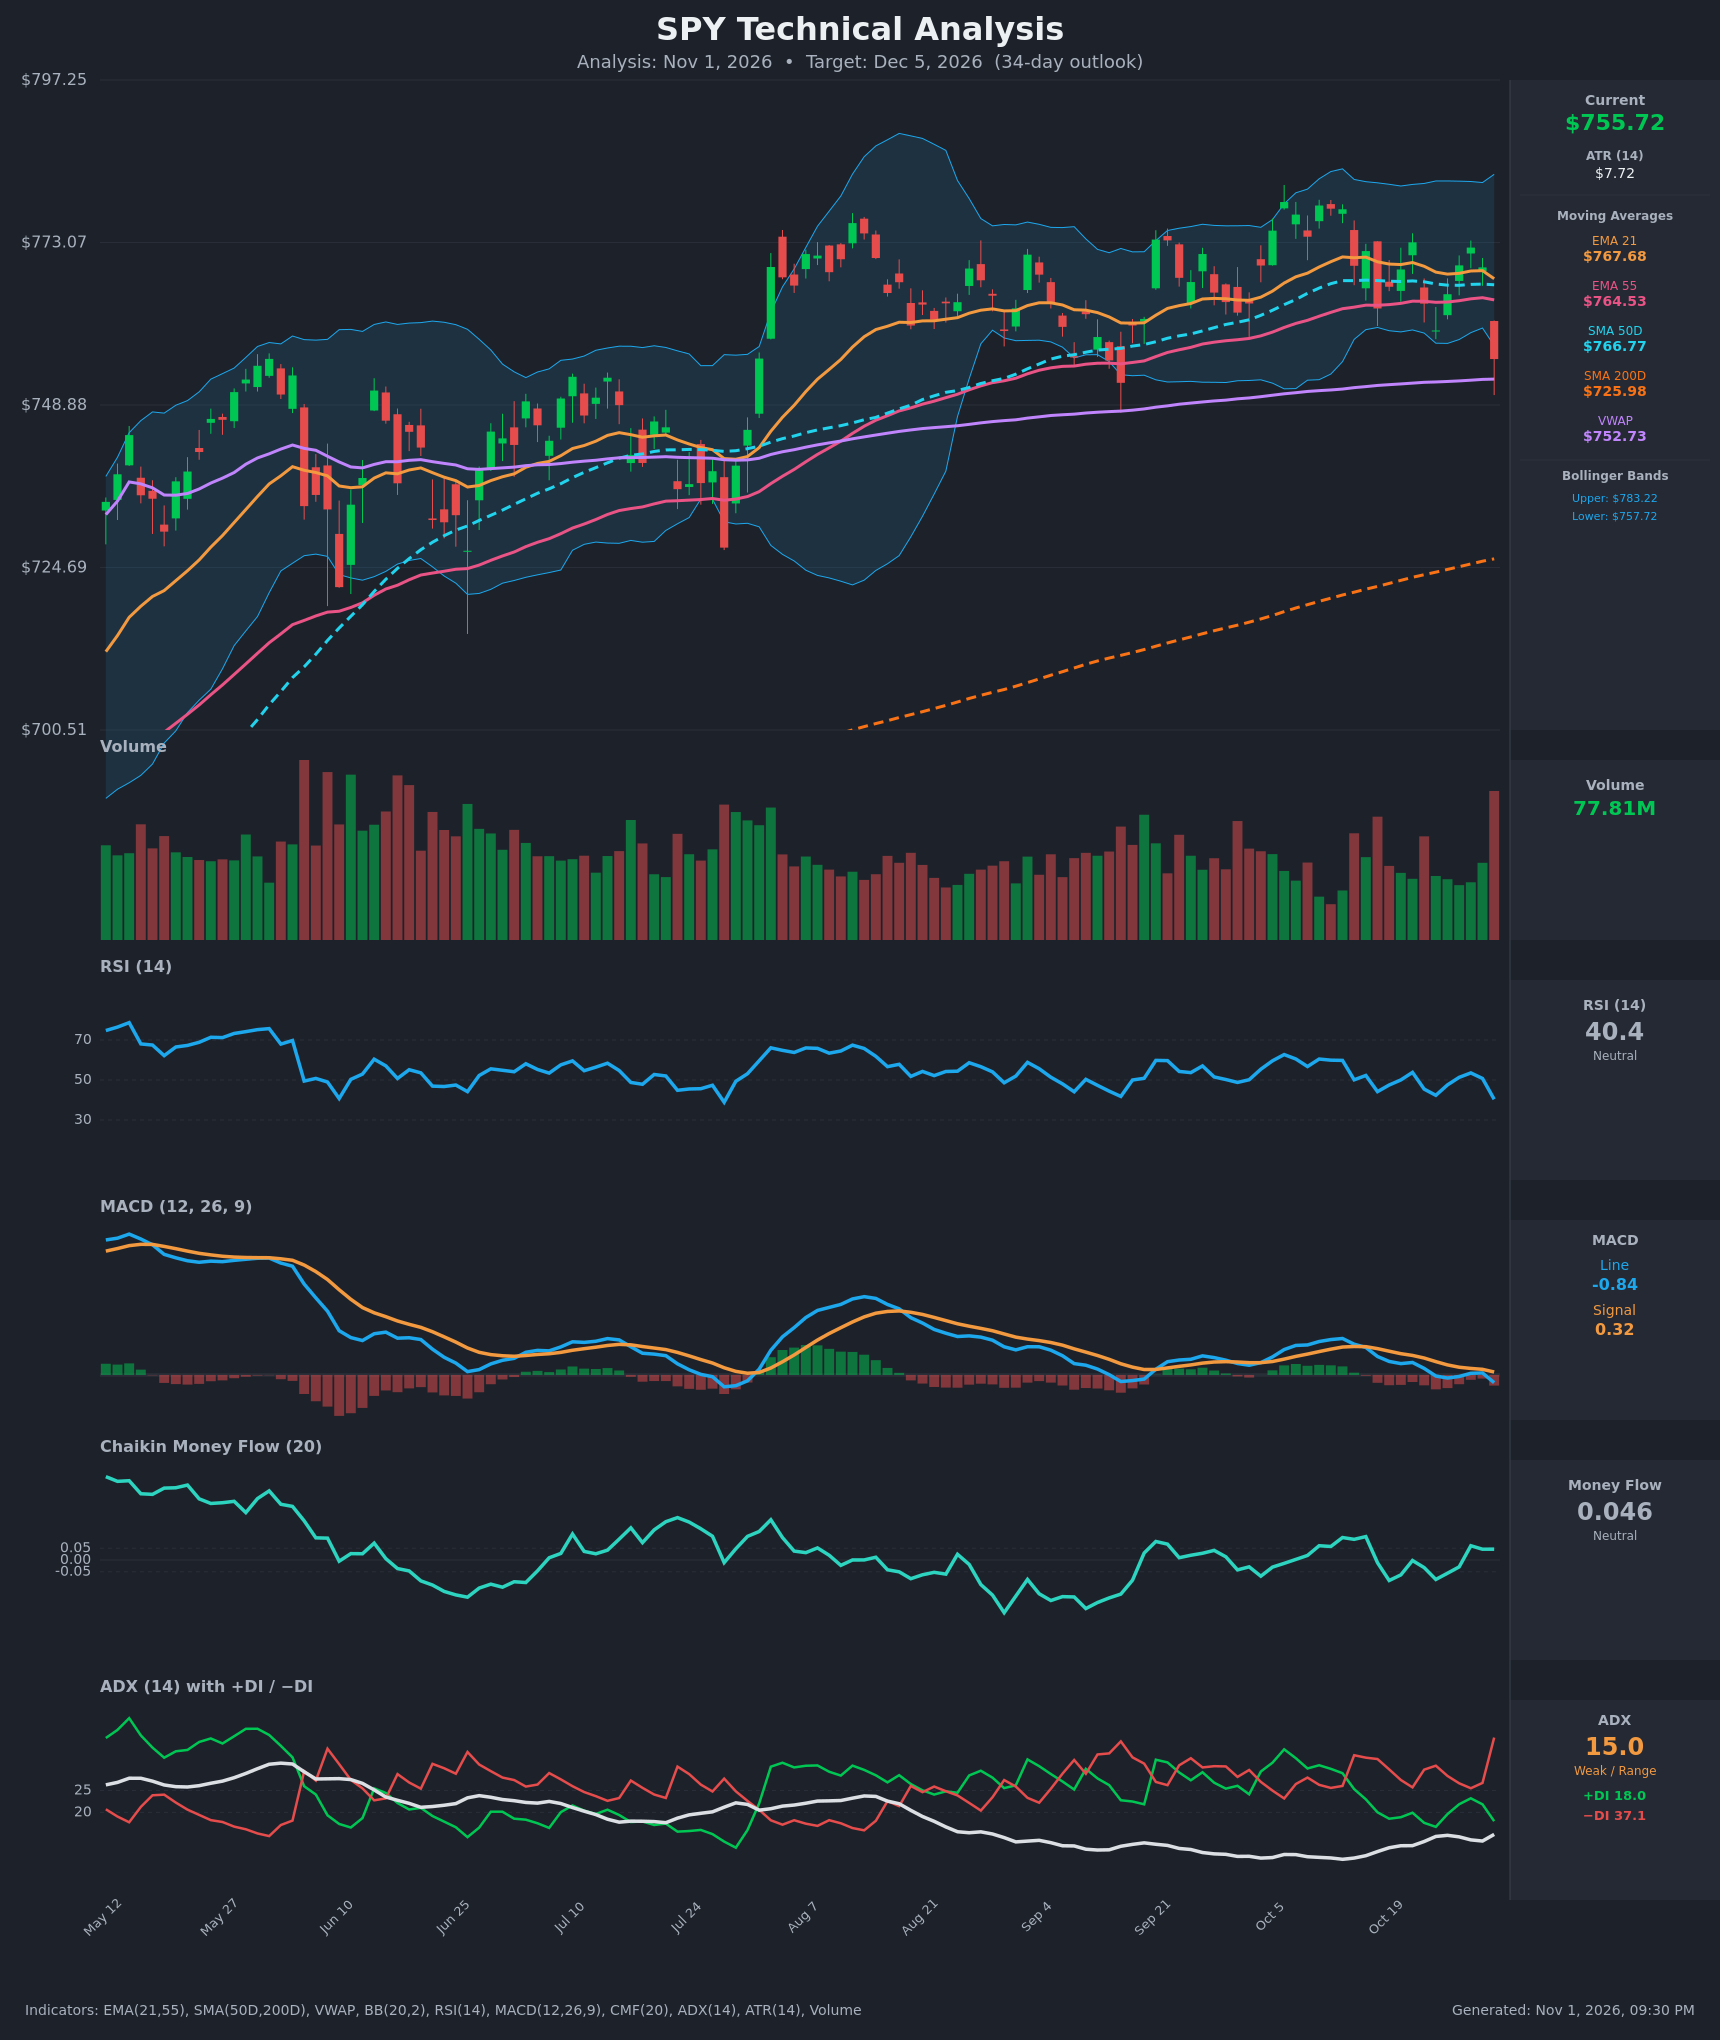
- RSI (14): 40.36, down sharply from 50.8 the day before and from about 60 on Oct 12. It is below the 50 midline but not oversold, so there is room to fall further. Momentum is clearly rolling over. [Bearish]
- 20 EMA (EMA 21): $767.68. Price at $755.72 is about 1.6% below it, so it now acts as overhead resistance. Price lost it on the Oct 30 drop after hugging it for weeks. EMA21 is still above EMA55 ($764.53), but the gap is narrowing. [Bearish]
- MACD: Line -0.84 vs signal 0.32, so a bearish crossover occurred on Oct 30 (the line was +0.22 vs +0.62 the day before). The histogram has turned negative and the line has dipped below zero, a loss of bullish momentum. [Bearish]
- Bollinger Bands (20): Upper $783.22, lower $757.72. Price closed below the lower band, an extension to the downside. The bands are fairly narrow, so volatility is moderate. A close outside the band can mean a short-term bounce or the start of a band walk. The June-July episode saw a band-walk breakdown, followed by a mean-reversion bounce. [Bearish]
- CMF (20): 0.046, just under the +0.05 accumulation threshold, so neutral. It has hovered around zero and has not yet shown the distribution you would expect after a sharp drop. This is a mild point in the bulls' favor. [Neutral]
- ADX (14): 15.0 with −DI 37.1 on top of +DI 18.0. The trend is weak, but ADX is turning up from about 9.3 and −DI has spiked, so bears are taking control. A rising ADX with −DI dominant would confirm a developing downtrend. [Weak Trend, bearish direction]
- Volume: 77.81M, the largest bar on the chart, and it is a red (down) bar. A high-volume decline into the Oct 30 close suggests institutional selling or a distribution/breakdown attempt rather than a quiet pullback. [Bearish]
Other moving averages:
- Price is below SMA50 ($766.77) and EMA55 ($764.53).
- Price is above VWAP ($752.73) and well above the rising SMA200 ($725.98), so the long-term uptrend is intact.
- SMA50 is far above SMA200 (a golden cross is already in place, no death cross).
DIVERGENCES & TRENDS
- No clear divergence. RSI and MACD are confirming the price drop rather than diverging from it.
- Momentum trend: RSI has made lower highs since the mid-October 59.9 peak. MACD has slipped from +3.99 to -0.84 and crossed below its signal line.
- DI shift: −DI has dominated +DI since Oct 14, and the gap widened sharply to 19 points on Oct 30.
- Break: Price fell through EMA21, EMA55, SMA50 and the lower Bollinger Band in a single high-volume candle. Price is now sitting just above VWAP and the roughly $750 swing-low zone. Previous lows near $748-750 (Aug/Sep) are the key test.
- CMF is the only flow indicator not yet confirming the selling.
CHART PATTERNS
- Bearish Triple Top (reversal), approximate: Highs near $773-785 have formed repeatedly since August, and lows near $748-752 act as a neckline. The latest candle is testing that neckline on heavy volume. A confirmed close below about $748-750 gives a measured move of roughly $25 (height of the pattern), pointing to about $723-725, which coincides with the rising SMA200.
- Range / consolidation: If the neckline holds, the pattern is just a broad Aug-Oct trading range. The weak ADX (15) supports that alternative.
- Pattern caveat: The triple top is loose rather than textbook, so confirmation requires a decisive close under $750.
POTENTIAL SCENARIOS
- Scenario 1: Bearish Neckline Breakdown — The high-volume rejection continues, the $750 support and VWAP ($752.73) fail, and −DI keeps leading with ADX rising. Trigger: daily close below $750 on above-average volume. Target: $735 first, then $725 (SMA200 and measured move). Invalidation: daily close back above $767.68 (EMA21). (45% probability)
- Scenario 2: Bullish Mean-Reversion Rebound — Price closed below the lower Bollinger Band and sits near VWAP and range support. A bounce reclaims the moving-average cluster and rotates to the top of the range. Trigger: close above $765 (EMA55/SMA50) with MACD curling up. Target: $780-783 (upper band and range highs). Invalidation: close below $748. (35% probability)
- Scenario 3: Neutral Range Chop — Weak ADX and positive-neutral CMF keep price in a $748-$768 range. Trigger: failure of both the $750 and $768 levels to break. Target: $755-$765. Invalidation: close outside $745-$770. (20% probability)
PRICE TARGETS
For the 34-day horizon (Dec 5, 2026):
- Target Price: $744.00
- Expected Range: $708.00 to $800.00 (width $92, about 12.2% of the current price, consistent with the 30-60 day guidance)
- Key Levels: Support at $750.00, Resistance at $767.68
OVERALL BIAS
OVERALL BIAS: BEARISH - A high-volume breakdown candle closed below the lower Bollinger Band and all key short-term moving averages, with a bearish MACD cross, −DI far above +DI, and a loose triple-top neckline now being tested. The long-term uptrend (above a rising SMA200) and the neutral CMF limit the downside, so the target is moderate rather than a deep selloff.
This is educational analysis and not financial advice.