XLF 34-day bullish forecast — Nov 1, 2026
- Bias: Bullish
- Timeframe: 34 days (made Nov 1, 2026, target date Dec 4, 2026)
- Price at analysis: $56.51
- Price target: $57.60
- Expected range: $53.20 – $60.40
- Result: Pending — graded after the close on Dec 4, 2026
Get a free AI analysis of XLF today
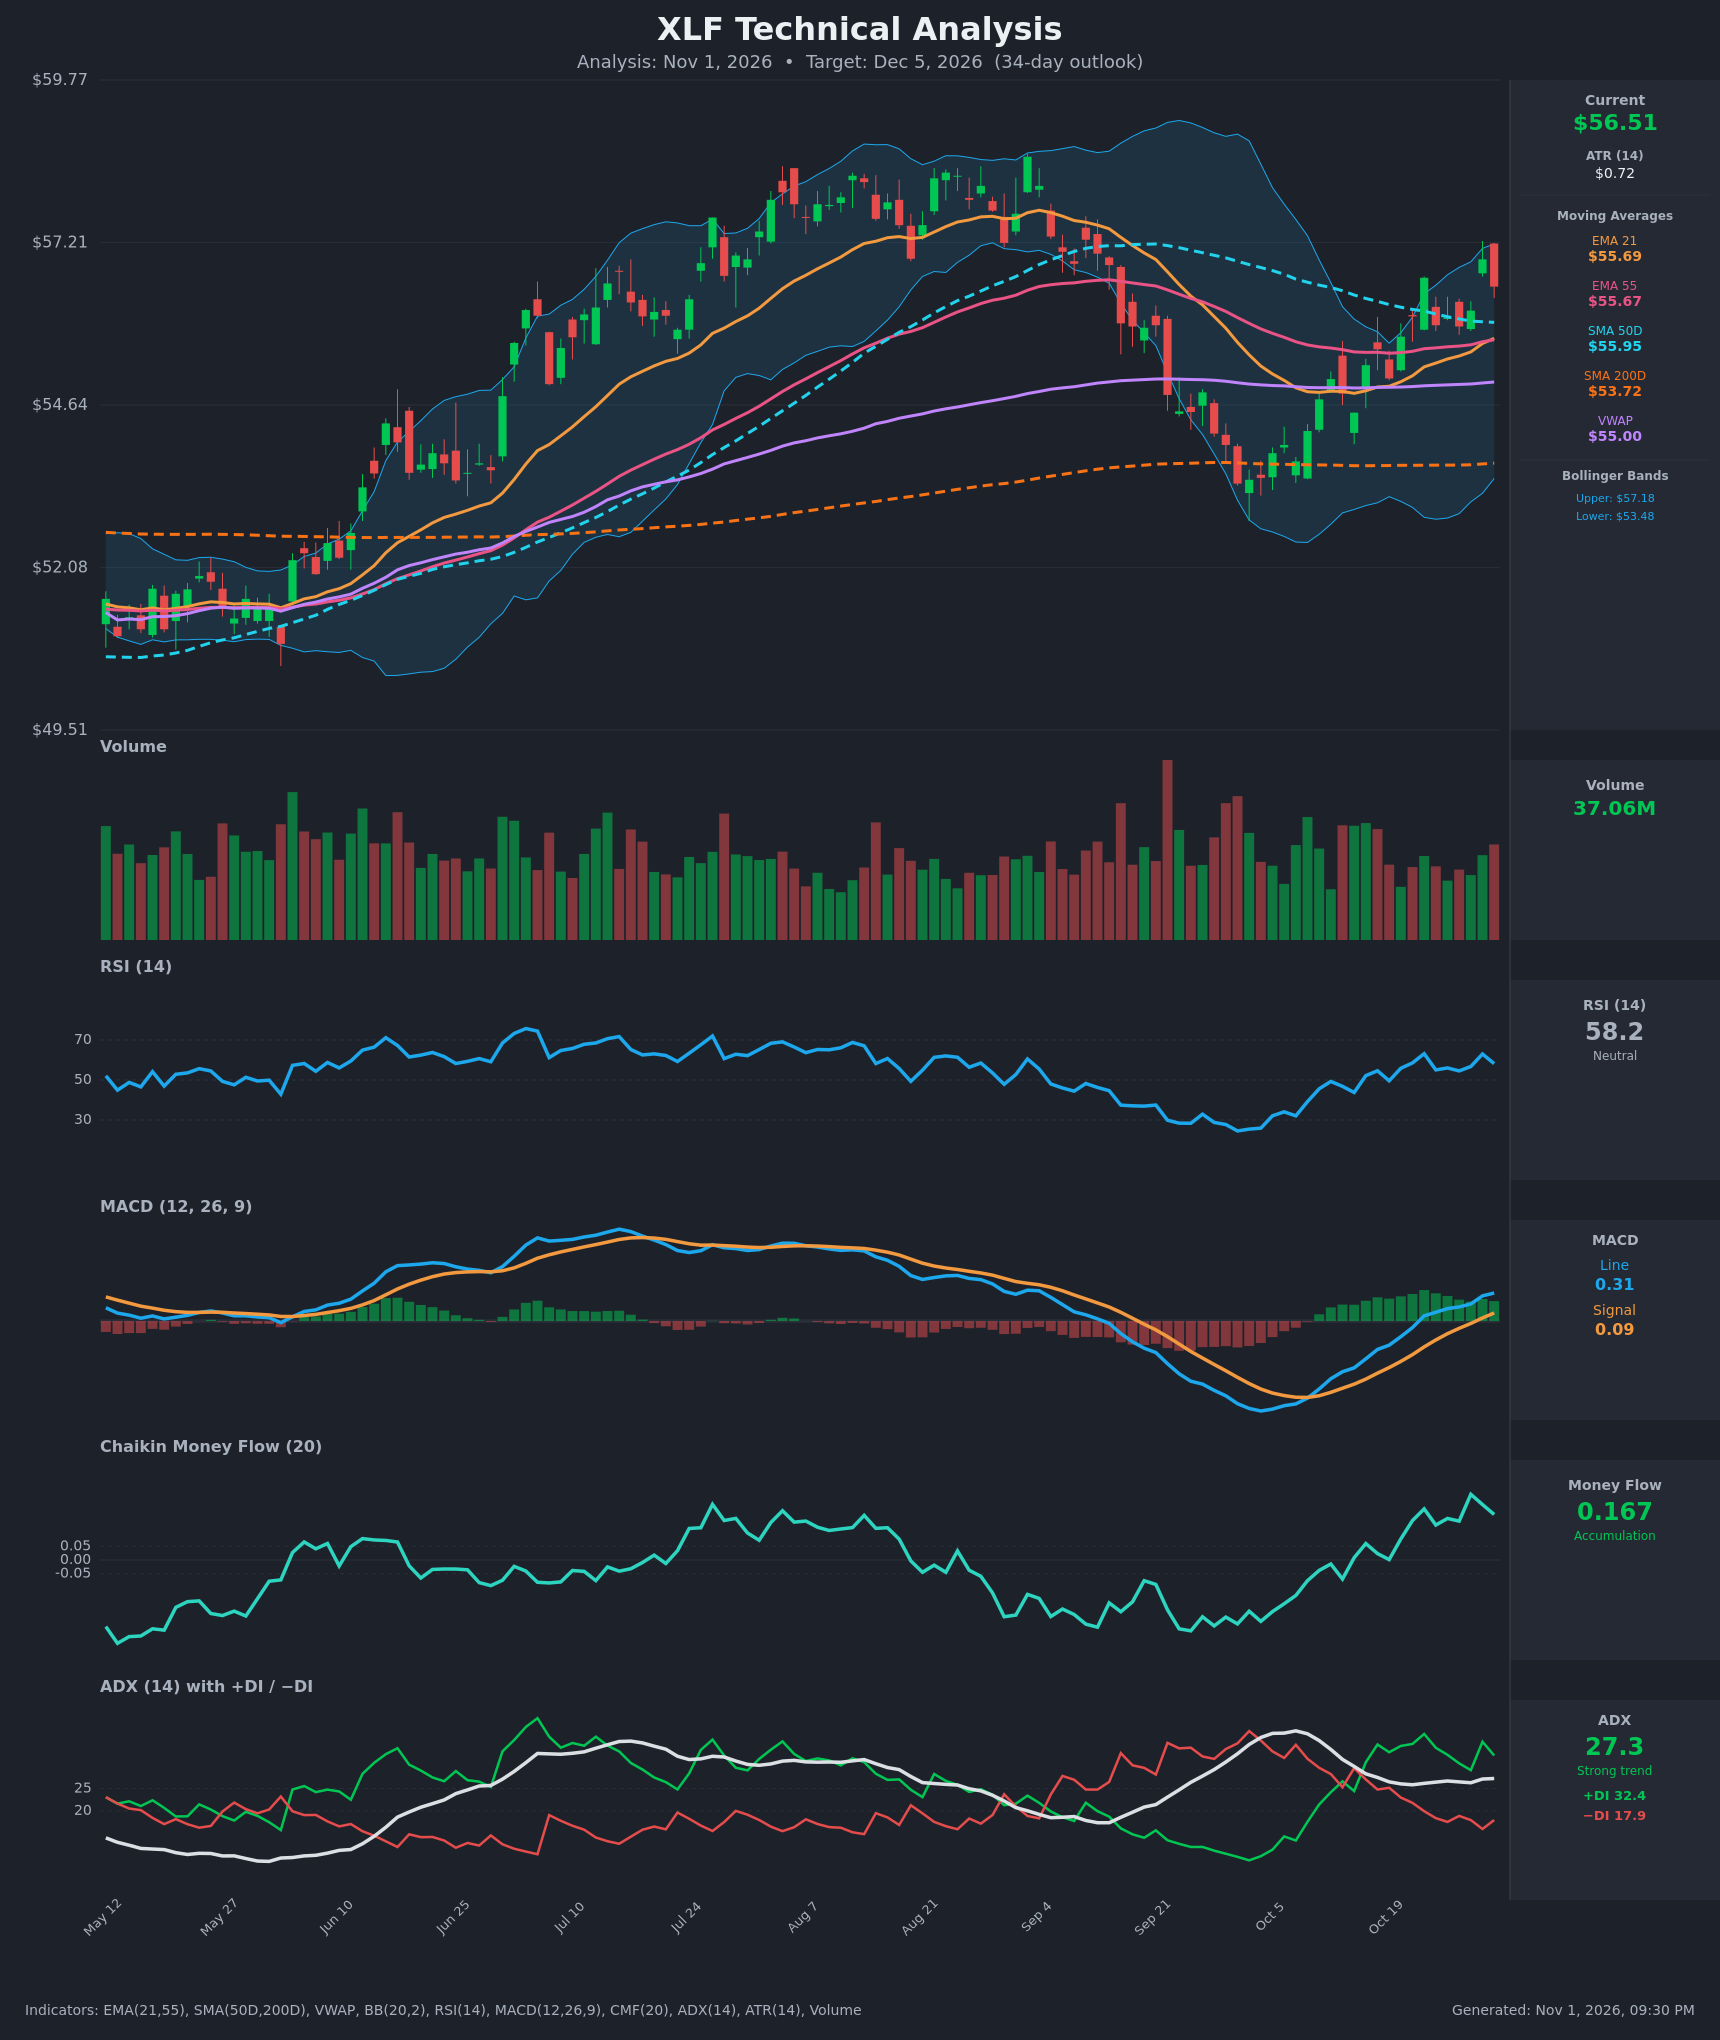
Analysis
TECHNICAL INDICATORS
- RSI (14): 58.19, in the upper half of neutral and below overbought. It has recovered from a low near 25-30 in early October and made a higher high at 63 on Oct 22 and again on Oct 29. Momentum is positive with room to run. [Bullish]
- 20 EMA: The EMA 21 is $55.69, and price at $56.51 sits about 1.5% above it. The EMA 21 has just crossed above the EMA 55 ($55.67), a fresh bullish crossover. The EMAs are sloping upward and now act as dynamic support. [Bullish]
- MACD: The line is 0.306 against a signal of 0.088, a positive spread of about 0.22. The bullish crossover came on Oct 22, and both lines are now above zero. The histogram is positive but has flattened slightly in recent bars. [Bullish]
- Bollinger Bands (20): The upper band is $57.18, the lower $53.48 and the midline about $55.33. Price at $56.51 is in the upper third of the bands, about 0.7 ATR below the upper band. The bands are narrowing after the September-October volatility. Price is riding above the midline without a squeeze or a breakout. [Bullish]
- CMF (20): 0.167, well above +0.05. It has been positive since mid-October and sits near its recent high, confirming real buying pressure behind the rally. [Accumulation]
- ADX (14): 27.3 with +DI at 32.4 and −DI at 17.9. The trend is strong, and +DI has been on top since Oct 15 with a wide gap. ADX is stable to slightly rising. [Strong Trend + Bullish]
- Volume: 37.06M, about average. The last candle is a red one that reversed from a high near $57.2, which is a minor sign of supply at that level. Volume has not expanded on the up-move, so confirmation is only moderate. [Neutral to mildly Bullish]
DIVERGENCES & TRENDS
- There is no clear bearish divergence yet. Price is making higher highs and RSI is making matching highs (about 63).
- The MACD histogram is flattening, and the last candle is a bearish rejection from near $57.2. Together these hint at short-term consolidation or a pullback.
- Price has reclaimed the EMA 21, EMA 55, SMA 50D ($55.95) and VWAP ($55.00), all now below price. The SMA 50D is still falling and is acting as a ceiling. A bullish EMA 21/55 cross has just occurred.
- The long-term trend is up: price is above the SMA200D ($53.72), which is rising, and the SMA50D is above the SMA200D, so no death cross.
- The +DI/−DI spread has been wide since mid-October, and CMF is at a multi-week high. Accumulation is confirming the rebound from the early-October low near $53.5.
CHART PATTERNS
- Bullish Double Bottom / V-shaped recovery: The pullback to the $53.4-$53.5 area near the SMA200D in early October, followed by a rebound, is a base. Price has since recovered above the 50 and 200-day averages. The recovery now retests the prior swing high near $57.2-$57.5, while the broader range peak in August was around $58.
- Bullish Flag / consolidation: Price is making shallow pullbacks inside a small channel of $55.7-$57.2 after the strong run from $53.5. This is a mild continuation setup. A close above $57.20 targets about $58.0-$58.5, consistent with the flag-pole measure and the previous range high.
- Resistance sits at $57.2-$57.5, which is also the upper Bollinger Band. The SMA 50D at $55.95 has become support.
POTENTIAL SCENARIOS
- Scenario 1: Bullish Breakout Continuation — Accumulation, a strong +DI and the fresh EMA cross carry price above the $57.20 resistance and toward the August highs. Trigger: daily close above $57.30 with volume above 40M. Target: $58.30-$58.80. Invalidation: close below $55.60 (EMA 21/55 cluster). (50% probability)
- Scenario 2: Neutral Consolidation — Price stalls beneath $57.20 and chops between about $55.70 and $57.20 as the bands narrow. Trigger: repeated rejections near $57.2 and holds above the SMA50D. Target: $56.00-$56.80. Invalidation: close above $57.40 or below $55.40. (28% probability)
- Scenario 3: Bearish Failed Rally — The rejection candle at $57.2 marks a lower high, and price loses the EMA cluster and VWAP. Trigger: close below $55.60 and MACD signal cross. Target: $54.00-$54.50 (lower band and SMA200D area). Invalidation: close above $57.20. (22% probability)
PRICE TARGETS
- Target Price: $57.60 (34-day horizon)
- Expected Range: $54.00 to $59.80 (width $5.80, about 10.3% of current price)
- Key Levels: Support at $55.70, Resistance at $57.20
Self-check: a 34-day horizon calls for a width of about 12-18%. Widening the range to match: Expected Range $53.60 to $60.00 (width $6.40 ≈ 11.3%). Further widening to the lower guidance bound: $53.20 to $60.40 (width $7.20 ≈ 12.7%), which fits the 30-60 day guidance.
Final figures:
- Target Price: $57.60
- Expected Range: $53.20 to $60.40
- Key Levels: Support at $55.70, Resistance at $57.20
OVERALL BIAS
OVERALL BIAS: BULLISH - Price is above all key moving averages and VWAP, with a fresh EMA 21/55 bullish crossover, a positive MACD cross above zero, strong ADX with +DI dominant, and CMF showing clear accumulation. The main risk is near-term resistance at $57.20, but the weight of evidence favors a push toward $57.60 and higher.
This is educational analysis and not financial advice.