AAL 48-day bullish forecast — Nov 1, 2026
- Bias: Bullish
- Timeframe: 48 days (made Nov 1, 2026, target date Dec 18, 2026)
- Price at analysis: $12.60
- Price target: $13.10
- Expected range: $11.80 – $13.95
- Result: Pending — graded after the close on Dec 18, 2026
Get a free AI analysis of AAL today
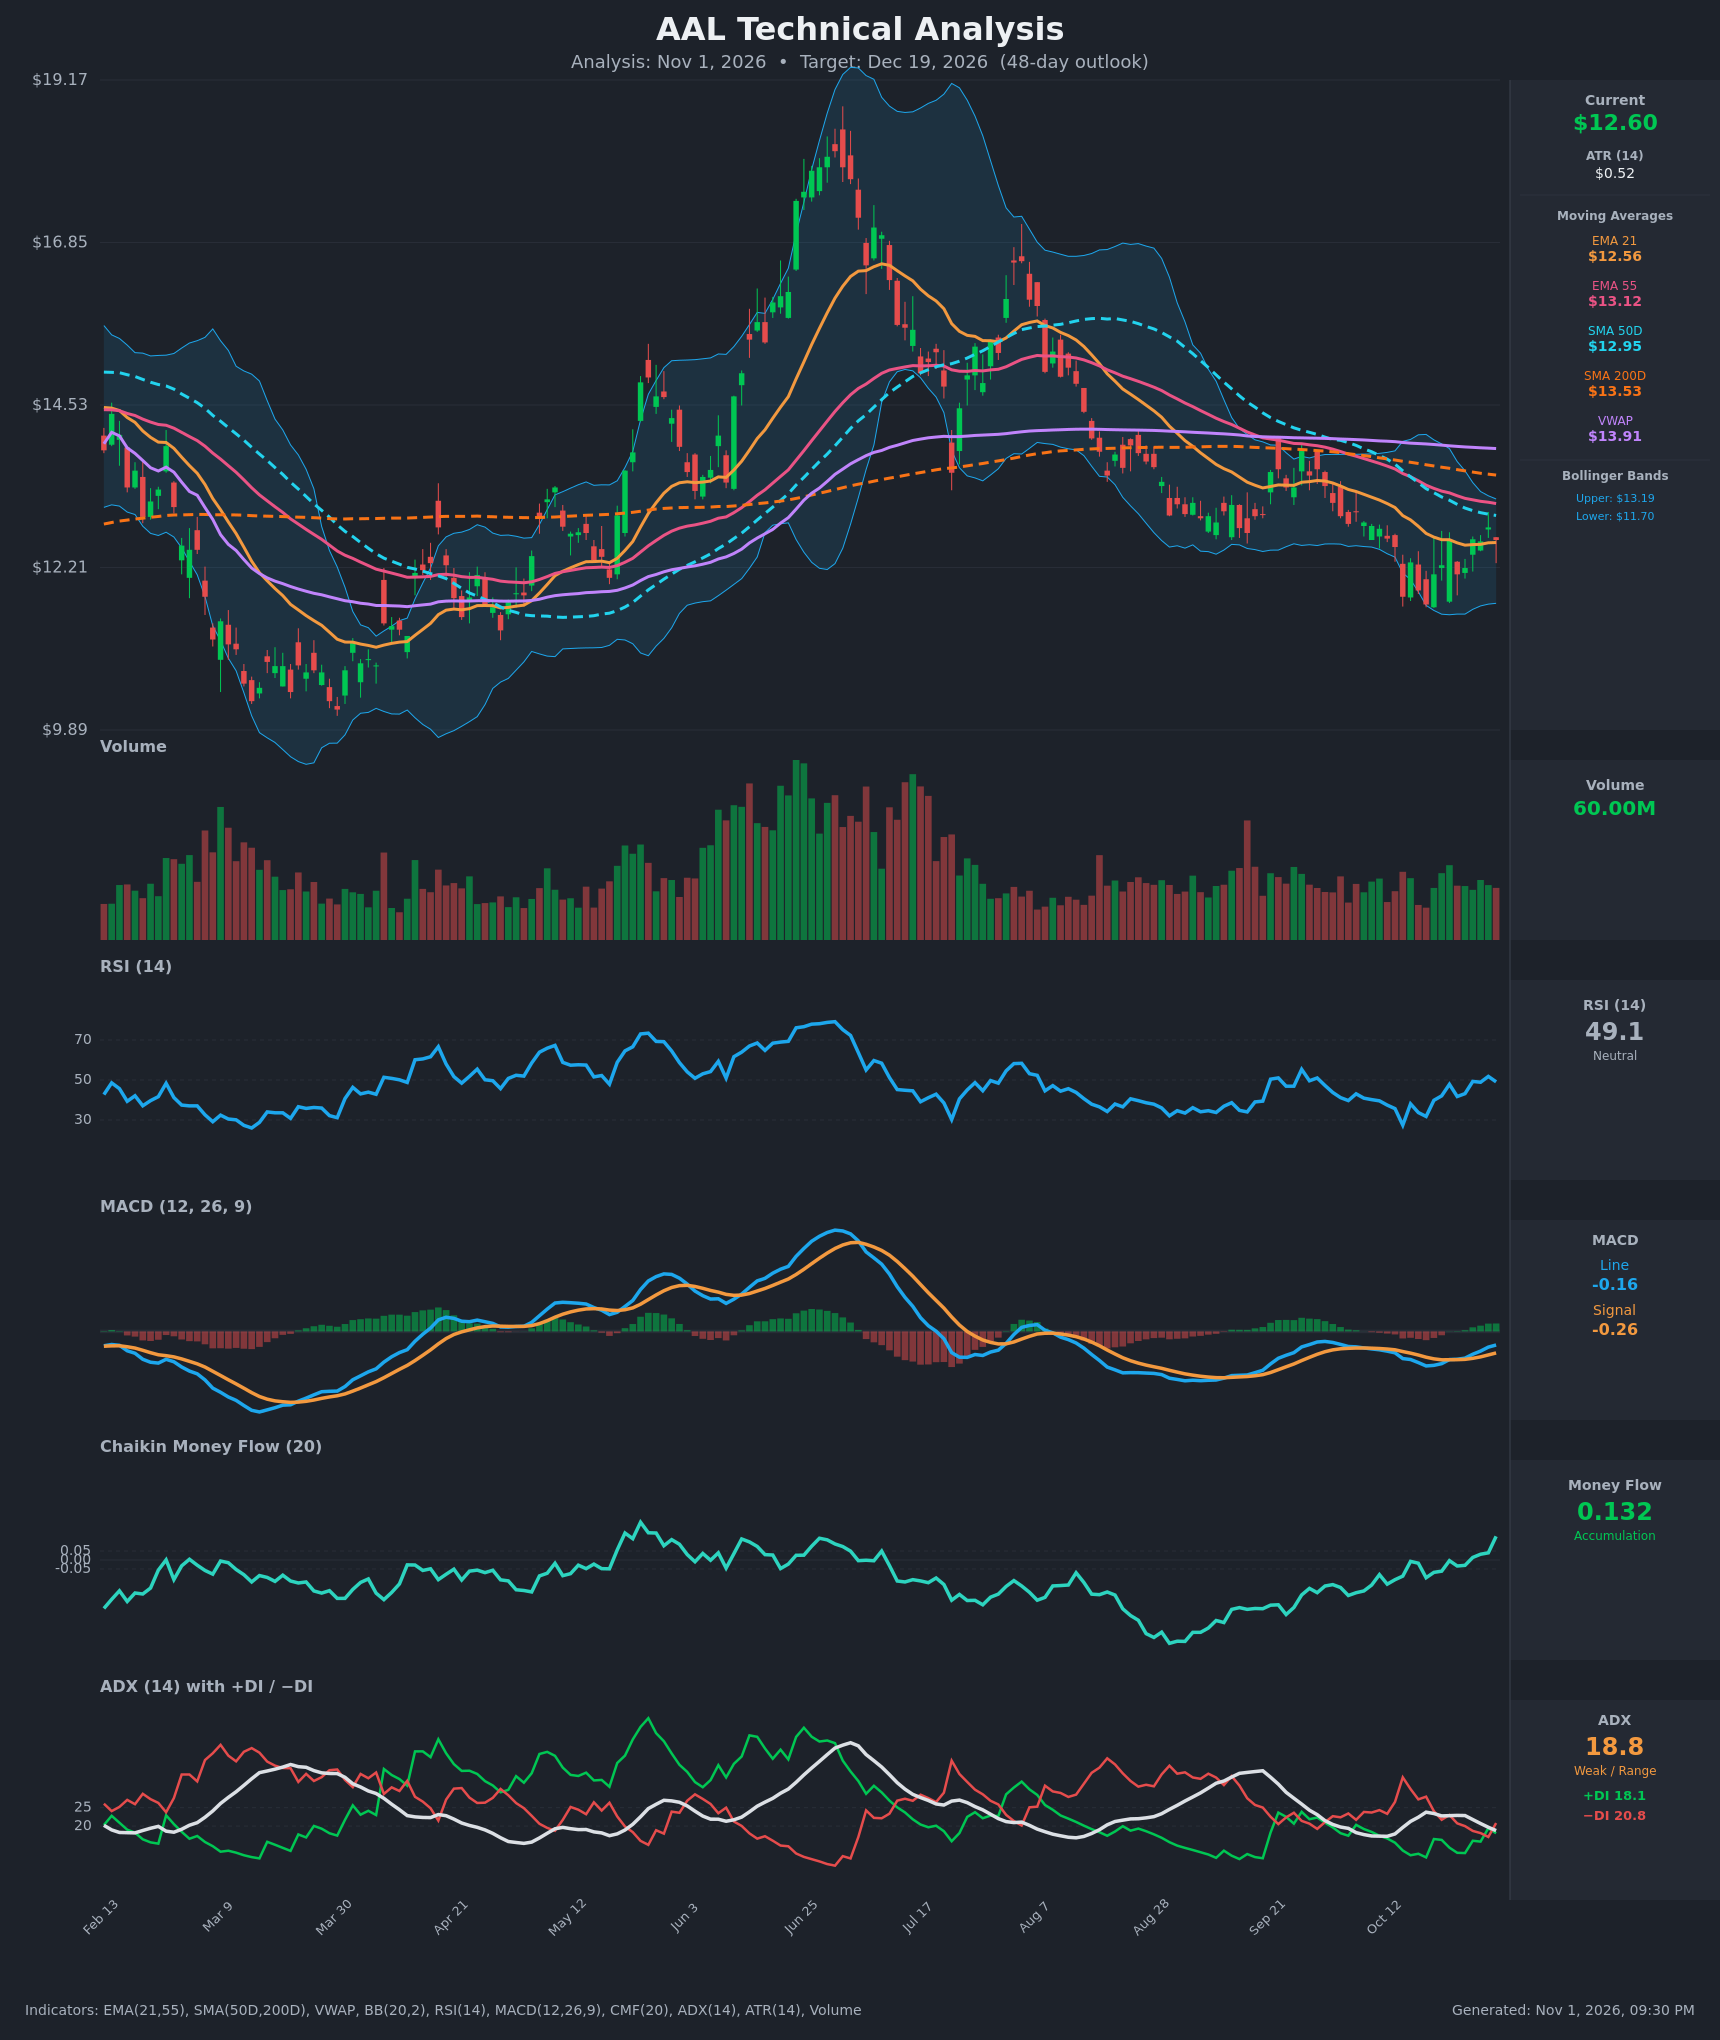
Analysis
TECHNICAL INDICATORS
- RSI (14): 49.08, right at the midline. It has recovered from the oversold-ish 27.4 on Oct 14 and 31.8 on Oct 19, and has held in the 42-52 band for the past week. Momentum is improving but not yet decisive. [Neutral]
- 20 EMA (EMA 21): $12.56, with price at $12.60 just above it. The EMA has flattened after a steep decline from $13.12 on Oct 12, so it is acting as marginal support. The EMA 55 at $13.12 is still well above price, so the EMA21 remains below the EMA55 (bearish alignment). [Neutral]
- MACD: Line -0.164 vs signal -0.260, giving a positive histogram of about +0.096. The line crossed above the signal around Oct 27 and the gap has widened for four straight bars. Both lines are still below zero, so this is a recovery inside a larger downtrend. [Bullish]
- Bollinger Bands (20): Upper $13.19, lower $11.70, midline about $12.44. Price is above the midline in the upper half of the band. The bands are fairly narrow compared with the June-August expansion, so volatility is low. The lower-band touch near $11.70 on Oct 19 held, and the upper band at $13.19 lines up with the EMA55 and SMA50 as overhead resistance. [Neutral]
- CMF (20): 0.132, up from -0.135 on Oct 12 and above the +0.05 threshold. The line has risen steadily over three weeks, so buying pressure is building even though price has barely moved. [Accumulation]
- ADX (14): 18.8 and falling from 23.8, so there is no trend. +DI is 18.1 and −DI is 20.8, so bears are still marginally on top. The DIs have converged, and +DI crossed above −DI briefly on Oct 29. [Weak Trend – slight bearish lean, fading]
- Volume: 60.0M, an average, unremarkable level. There has been no climactic selling and no breakout surge. The latest up bars on the chart show slightly better volume than the down bars, which is consistent with the CMF. [Neutral/mildly supportive]
DIVERGENCES & TRENDS
- Bullish divergence: Price made a lower low on Oct 19 ($11.68, versus $11.79 on Oct 14). The RSI low was higher (31.8 vs 27.4), and the MACD line is now making higher lows. CMF has moved from -0.135 to +0.132, which shows accumulation.
- Moving averages: Price is below the EMA55 ($13.12), SMA50 ($12.95), SMA200 ($13.53) and VWAP ($13.91). The SMA50 is already below the SMA200 (a death cross in place), so the long-term trend is down.
- Slope of the averages: The SMA50 is still declining but is converging toward price. The EMA21 has flattened, and a move above the SMA50 near $12.95 would be the first real trend-repair signal.
- MACD: Bullish signal-line crossover (Oct 27) below zero, with the histogram turning positive.
- ADX: The DIs are converging, so neither side controls the market.
CHART PATTERNS
- Bullish Double Bottom (forming): Lows near $11.68-$11.79 (Oct 14 and Oct 19) with a neckline near $12.8-$13.0, which coincides with the SMA50. A confirmed close above about $13.00 projects a measured move of roughly $1.2 (neckline minus low), so about $14.2. This is not yet confirmed.
- Consolidation range: Since September, price has ranged between about $11.7 and $13.2 with falling ADX. This is a base or range just under a cluster of resistance (SMA50, EMA55, SMA200 and VWAP between $12.95 and $13.91).
- Bearish alternative: If the range breaks down, price would revisit the $11.70 low. A close below it would open a bearish continuation toward $10.5-$11.0, the March-April base area.
POTENTIAL SCENARIOS
- Scenario 1: Bullish Double-Bottom Breakout — Accumulation (CMF +0.13), the MACD crossover and the higher RSI lows support a push through the SMA50/EMA55 zone and a retest of the SMA200. Trigger: daily close above $13.00-$13.20 (SMA50, EMA55, upper Bollinger Band). Target: $13.50-$13.90 (SMA200, VWAP), with an extension to about $14.20. Invalidation: close below $12.20, then $11.70. (45% probability)
- Scenario 2: Neutral Range Chop — Weak ADX keeps price between $11.9 and $13.2, capped by the stacked moving averages and supported by the EMA21 and lower band. Trigger: repeated rejections near $13.0-$13.2 and holds above $12.2. Target: $12.3-$12.9. Invalidation: a decisive close outside $11.70-$13.20. (22% probability)
- Scenario 3: Bearish Rejection and Breakdown — Price fails at the declining SMA50/EMA55, with −DI regaining control and the long-term downtrend resuming. Trigger: close below $12.20, then below the $11.70 lows. Target: $11.70, then $11.00. Invalidation: close above $13.20. (33% probability)
PRICE TARGETS
- Target Price: $13.10 (48-day horizon, about +4% from $12.60)
- Expected Range: $11.80 to $13.95 (width $2.15, about 17% of the current price, in line with the 30-60 day guidance of 12-18%)
- Key Levels: Support at $12.20, Resistance at $12.95 (SMA50). Beyond those, major support is $11.70 and major resistance is $13.53 (SMA200).
OVERALL BIAS
OVERALL BIAS: BULLISH - Positive CMF accumulation, a MACD bullish crossover, higher RSI and MACD lows, and a potential double bottom near $11.70 favor a recovery toward the $13.1-$13.5 resistance cluster. Conviction is modest because price remains below the SMA50, SMA200, EMA55 and VWAP and ADX is weak.
This is educational analysis and not financial advice.