AMD 48-day bearish forecast — Nov 1, 2026
- Bias: Bearish
- Timeframe: 48 days (made Nov 1, 2026, target date Dec 18, 2026)
- Price at analysis: $504.80
- Price target: $485.00
- Expected range: $440.00 – $525.00
- Result: Pending — graded after the close on Dec 18, 2026
Get a free AI analysis of AMD today
Analysis
TECHNICAL INDICATORS
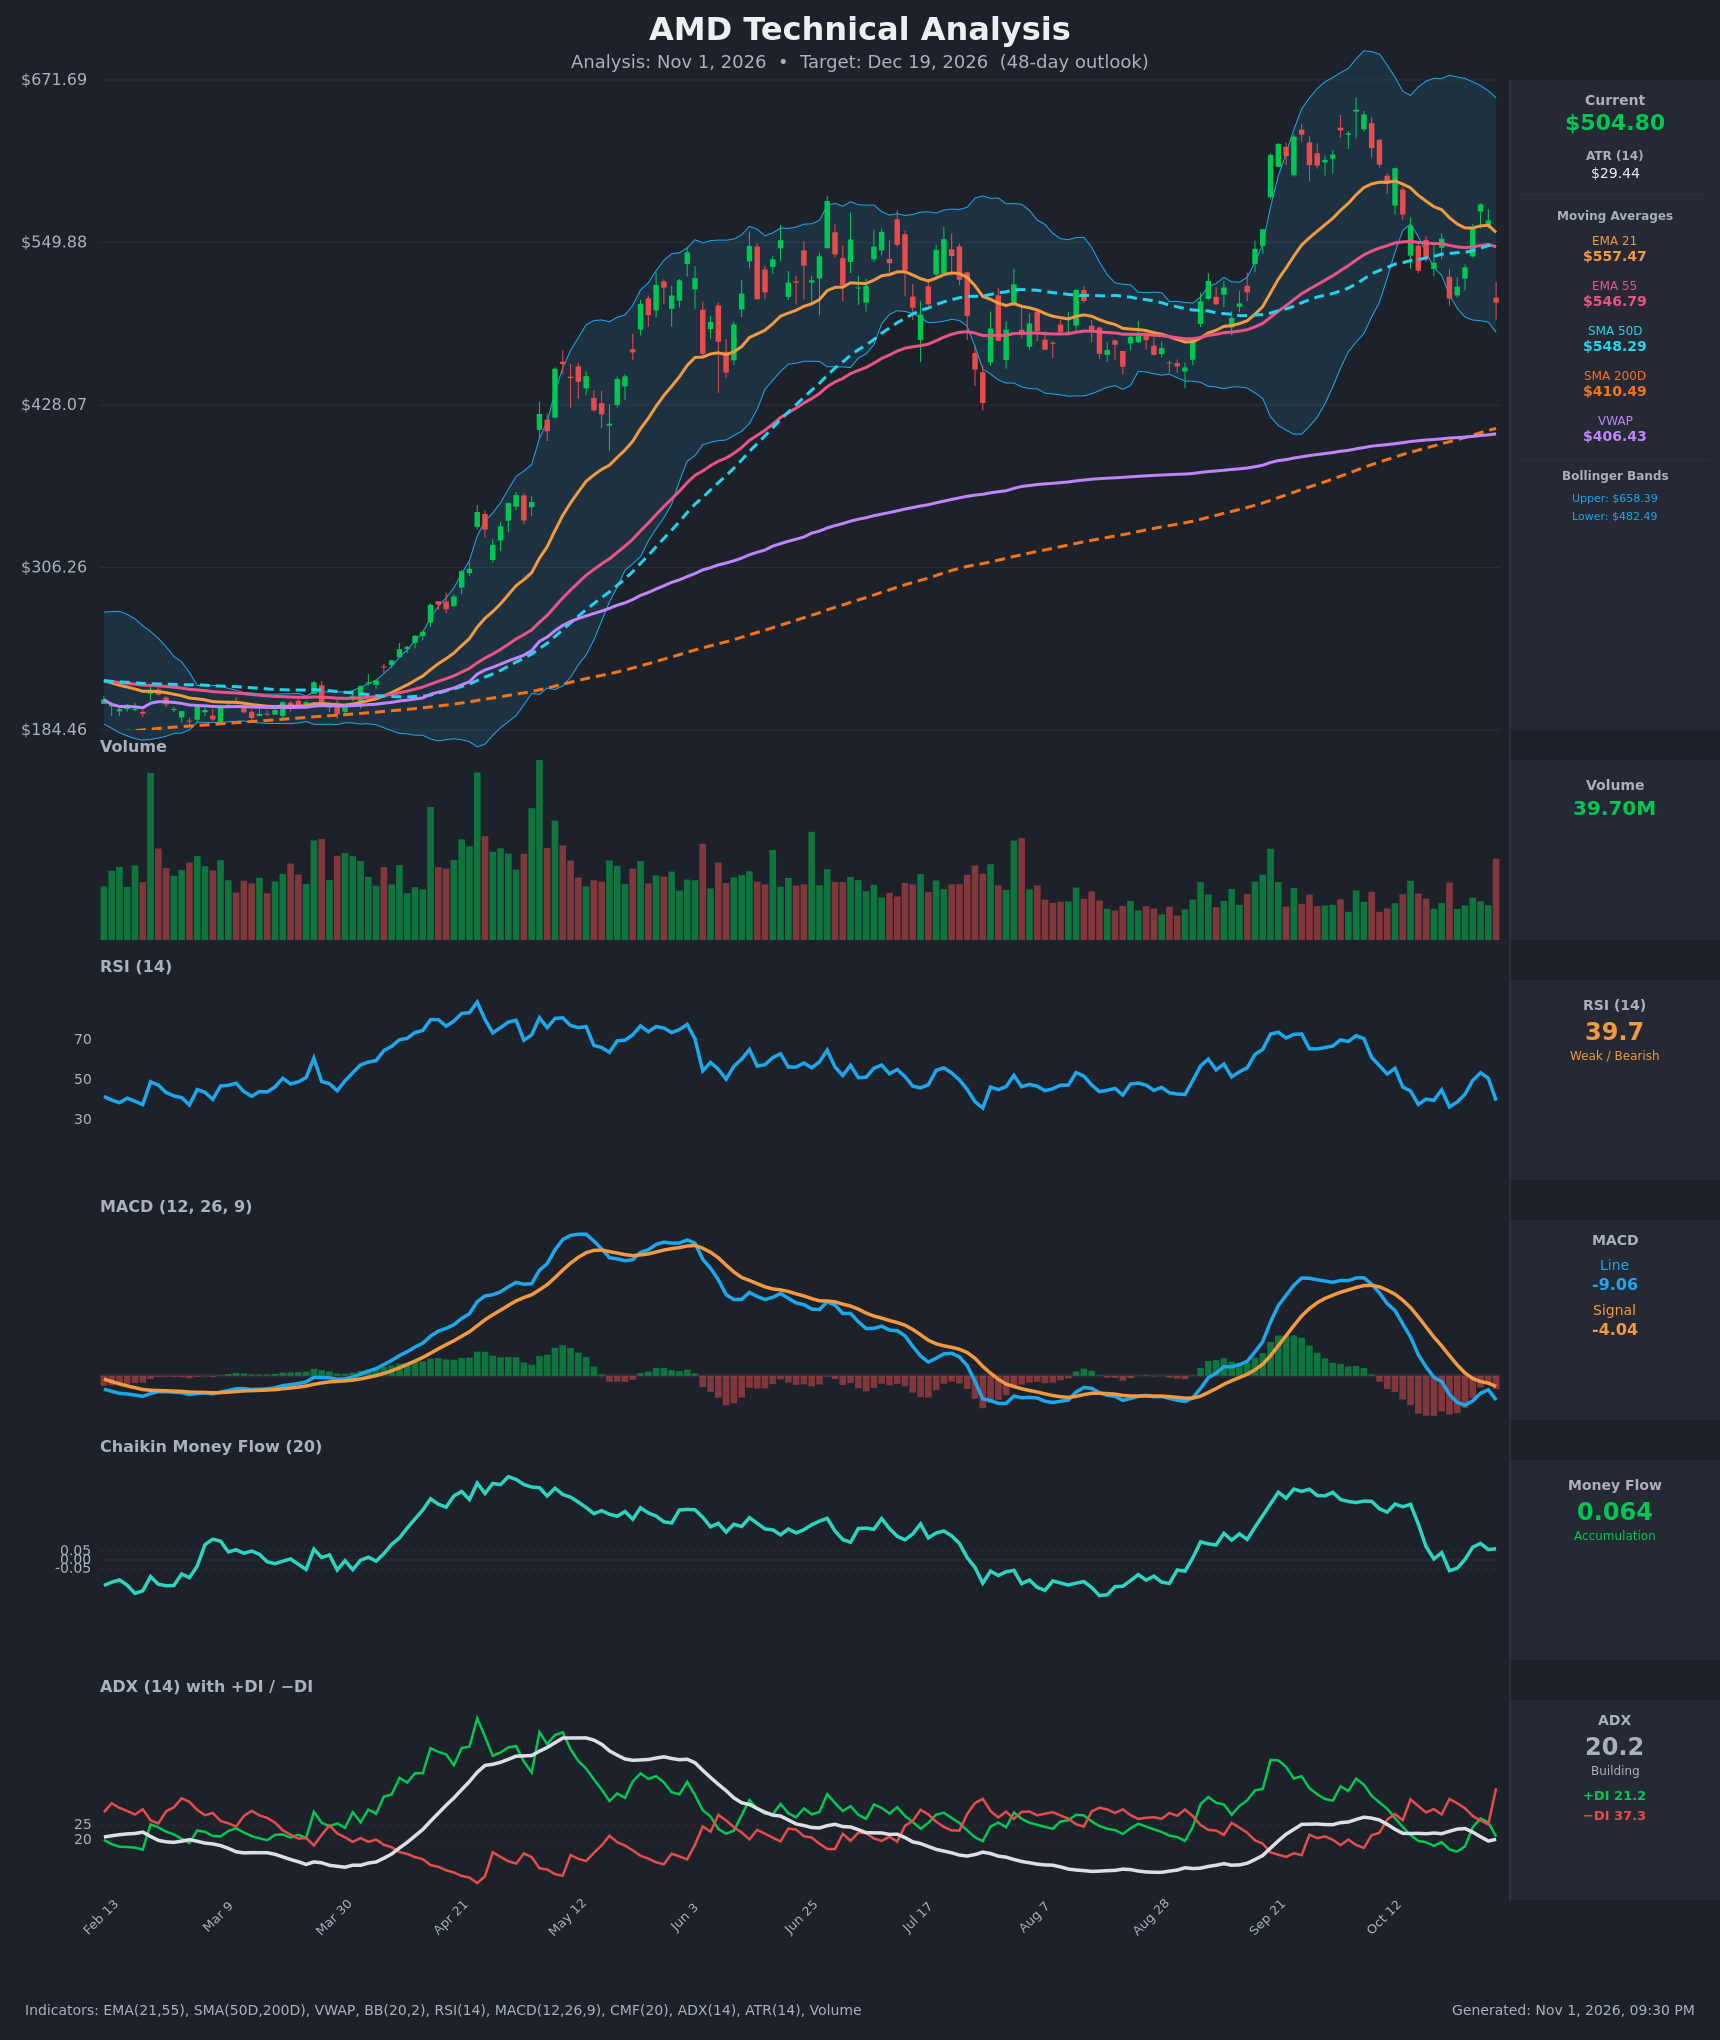
- RSI (14): 39.67, down sharply from 50.9 a day earlier and below the 50 midline. It is not oversold (<30). The last two swings (Oct 16 at 37.8 and Oct 22 at 36.5) found a floor in the high 30s, and momentum is turning down again. [Bearish]
- 20 EMA (EMA 21): $557.47. Price at $504.80 is about 9% below it, so the EMA is overhead resistance. The EMA 21 has been falling since Oct 13 and sits just above the EMA 55 ($546.79). A bearish EMA 21/55 cross is close. [Bearish]
- MACD: Line -9.06 is below Signal -4.04, a bearish crossover that occurred around Oct 20. The histogram is negative (about -5) and widened on the latest bar after a brief narrowing. Both lines are below zero. [Bearish]
- Bollinger Bands (20): Upper $658.40, lower $482.49, midline roughly $570. Price is in the lower third of the bands and about $22 (4.5%) above the lower band. The bands are wide, so volatility is elevated. A close below $482 would be a band-walk breakdown. [Bearish]
- CMF (20): 0.064, marginally above the +0.05 accumulation threshold. It has faded from 0.31 in mid-October and is hovering near neutral. A -$61 drop on heavy volume is not consistent with real accumulation, so the buying pressure is weak. [Neutral]
- ADX (14): 20.2, borderline and only just rising. −DI at 37.3 is well above +DI at 21.2 after a sharp bearish DI widening on the latest bar. Selling pressure is clearly dominant even though the trend is not yet strong. [Weak Trend, Bearish direction]
- Volume: 39.70M on the latest red candle, a spike against the quiet recent baseline. A heavy-volume decline of about -10.9% in one session signals aggressive distribution, not a routine pullback. [Bearish]
Moving average structure:
- SMA 50D / SMA 200D: $548.29 vs $410.49. There has been a golden cross for a long time, and price is still above the SMA 200D, so the long-term uptrend is intact.
- VWAP: $406.43, far below price. This shows how extended the longer-term rally is.
DIVERGENCES & TRENDS
- There is no clear bullish RSI divergence. RSI lows (37.8, 36.5, now 39.7) are roughly equal, while price made lower closes of $528 and $508 and is now at $504.80. That is a mild double-bottom in RSI at best, and it is not confirmed.
- MACD peaked in early September and has made a lower high since, which is consistent with the price rolling over from the ~$650 peak.
- Price is making lower highs in the rebound structure ($605, $578) after the September–October peak near $650, and lower lows ($507.93, now $504.80).
- The EMA 21 is rolling over toward the EMA 55 and SMA 50D. All three are clustered at $547–557 and now act as a resistance band.
- The latest bar is a sharp reversal. Price failed at $578, and the close of $504.80 is a -10.9% day that broke the October 22 low of $507.93.
- The −DI spike from 25 to 37 on one bar confirms the new selling thrust.
- The 200-day SMA ($410) and VWAP ($406) are rising and converging, forming a deep support zone about 19% below price.
CHART PATTERNS
- Bearish Rising Wedge / failed rebound: The advance from the late-August base to the ~$650 peak followed by a series of lower highs resembles a topping structure. It is not a textbook match.
- Bearish Pennant / Flag (continuation): The consolidation between $507 and $578 after the sharp drop from $650 resembles a bearish flag. The latest breakdown below $507.93 is the trigger. A measured move of the prior leg (roughly $650 to $528, about $120) projects toward $390–$400 at the extreme, though that is an aggressive target.
- Broader range: Price spent July–August between roughly $420 and $520. A return into that range is plausible, with the lower end around $460–$480 as the first major support (the Bollinger lower band at $482 and the August swing area).
POTENTIAL SCENARIOS
- Scenario 1: Bearish Breakdown Continuation — The bearish flag breakdown below $507 continues, with −DI dominant and MACD negative. Price drifts toward the lower Bollinger Band and the old consolidation range. Trigger: close below $482.49 (lower band) on elevated volume. Target: $450, with an extension to $425. Invalidation: daily close back above $557 (EMA 21). (50% probability)
- Scenario 2: Neutral Choppy Range — Price stabilizes between $480 and $560 as RSI holds in the high 30s and the 200-day SMA lies far below. Trigger: bounces from $482–$490 that fail at the $545–$557 moving-average cluster. Target: $500–$525. Invalidation: close below $480 or above $560. (22% probability)
- Scenario 3: Bullish Rebound — The sell-off proves a shakeout, RSI forms a higher low, and price reclaims the EMA cluster as the uptrend resumes. Trigger: close above $557 with CMF rising above 0.10. Target: $575–$600. Invalidation: close below $482. (28% probability)
PRICE TARGETS
For a 48-day horizon (about 12–18% range width guidance for 30–60 days; I used ~17%):
- Target Price: $485.00
- Expected Range: $440.00 to $525.00 (width $85 = ~16.8% of current price)
- Key Levels: Support at $482.49 (lower Bollinger Band; then $450), Resistance at $547.00 (EMA 55 / SMA 50D cluster; then $557.47)
Self-check: $85 / $504.80 = 16.8%, which is within the 12–18% guidance for a 30–60 day timeframe. The target is below the current price, consistent with a bearish bias.
OVERALL BIAS
OVERALL BIAS: BEARISH - Price broke to a new low on a heavy-volume −10.9% day, −DI (37.3) dominates +DI (21.2), MACD is below its signal line, and price sits below the EMA 21/55/SMA 50D band, which is now resistance. The long-term uptrend (above the SMA 200D) and the rising SMA 200D limit the downside, so the target is a measured move toward the $485 area rather than a collapse.
This is educational analysis and not financial advice.