AAPL 48-day bullish forecast — Nov 1, 2026
- Bias: Bullish
- Timeframe: 48 days (made Nov 1, 2026, target date Dec 18, 2026)
- Price at analysis: $344.63
- Price target: $354.00
- Expected range: $322.00 – $372.00
- Result: Pending — graded after the close on Dec 18, 2026
Get a free AI analysis of AAPL today
Analysis
TECHNICAL INDICATORS
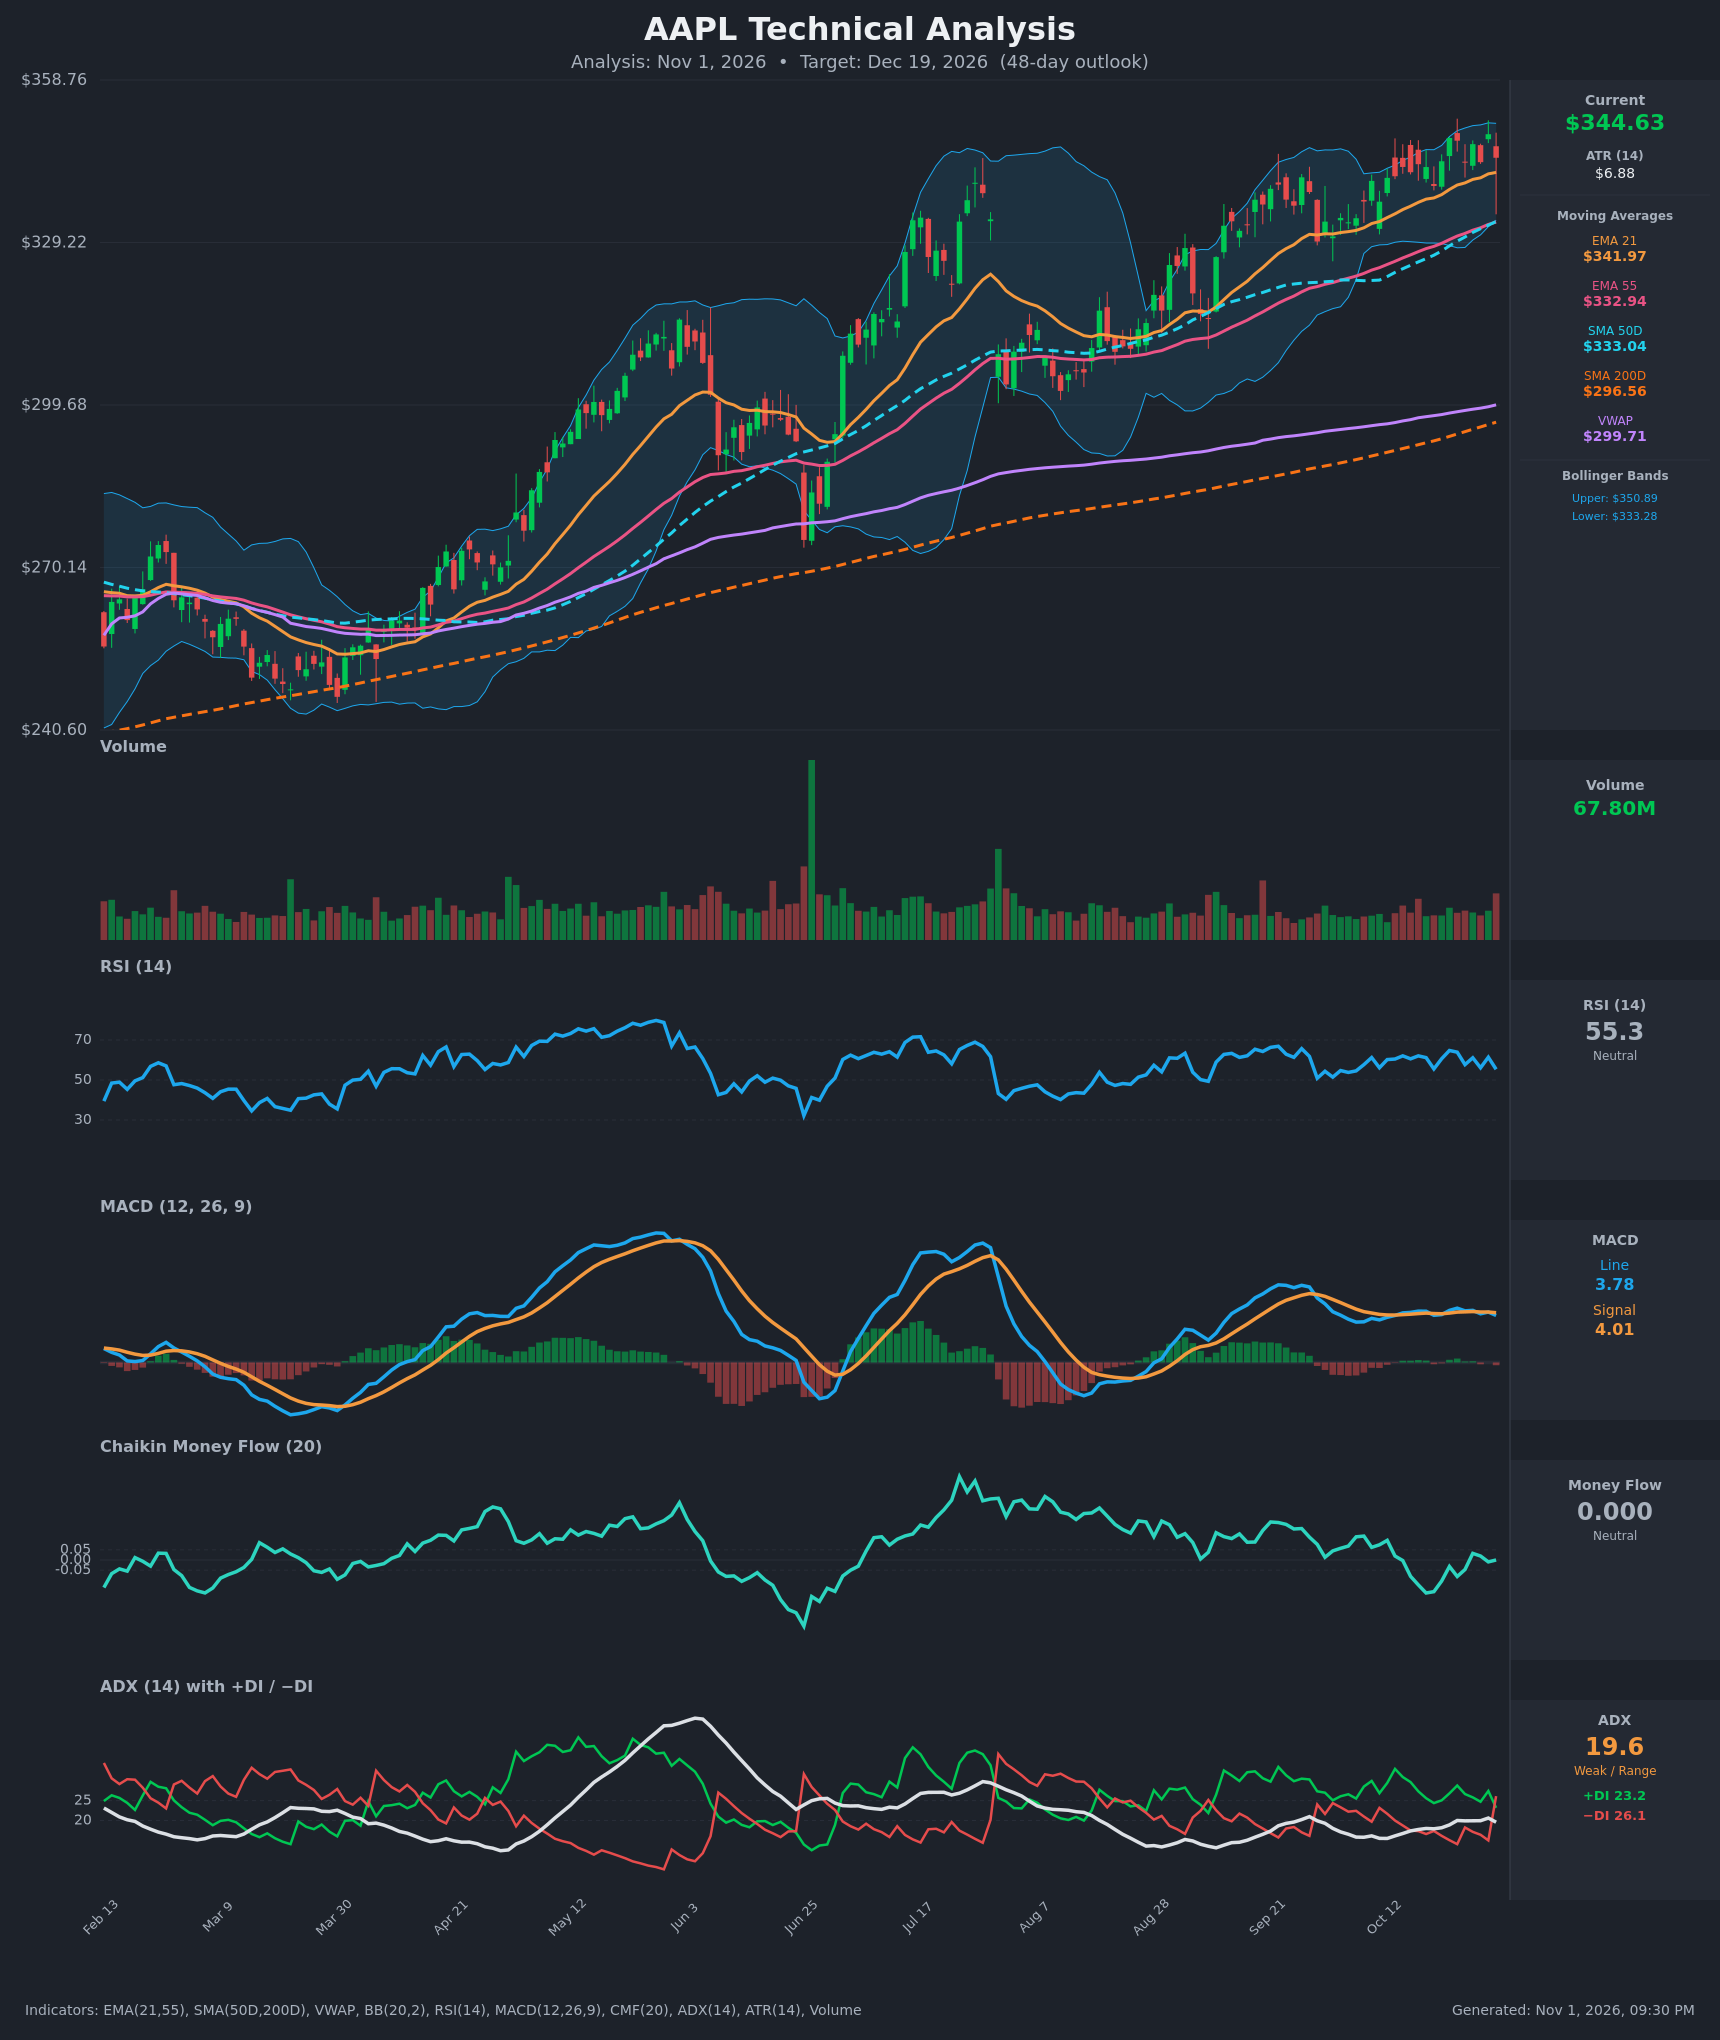
- RSI (14): 55.35, down from the 60-65 zone in mid-to-late October (64.8 on Oct 22, 55.3 now). It is mid-range with no overbought or oversold condition, and momentum has cooled but is not broken. [Neutral]
- 20 EMA: The EMA 21 is $341.97 and price ($344.63) sits about $2.66 above it. The EMA has risen steadily from $333.75 to $341.97 over 15 bars and has acted as dynamic support on every dip. [Bullish]
- MACD: The line is 3.78 against a signal of 4.01, so the histogram is slightly negative (about -0.22). The line has slipped just under the signal after hovering around it for weeks. It is still well above zero but flat and lacking impetus. [Neutral]
- Bollinger Bands (20): Upper $350.89, lower $333.28, so price is in the upper half, about 65% of the band width. The bands are moderately wide after the grind higher, and the lower band coincides with the 50D SMA and EMA 55 near $333. Price keeps riding the upper half without a clean break above. [Bullish]
- CMF (20): 0.000, inside the ±0.05 neutral band. It has faded from +0.097 on Oct 12 and spent most of the last two weeks slightly negative, so buying pressure has stalled. [Neutral]
- ADX (14): 19.6 with +DI 23.2 and −DI 26.1. ADX is below 20, which signals a weak or range-bound trend. −DI crossed above +DI on the latest bar, a small bearish tilt in directional control. [Weak Trend, slight bearish tilt]
- Volume: 67.80M on the latest bar. This is the heaviest reading in several weeks, on a red candle with a long lower wick. It suggests some distribution near highs, but the wick shows dip-buying. Overall volume is unremarkable versus the average. [Neutral/Slightly Bearish]
Moving average structure is strongly bullish:
- Price is above all averages: EMA21 $341.97, EMA55 $332.94, SMA50D $333.04, SMA200D $296.56 and VWAP $299.71.
- The 50D SMA is well above the 200D SMA, so the golden cross is long established.
- The EMA 21 is above the EMA 55, and all the averages are rising.
DIVERGENCES & TRENDS
- No major divergence: Price made higher highs ($348.22 on Oct 22, $348.91 on Oct 29) while RSI peaked lower (64.8, then 61.4). This is a mild bearish momentum divergence and a sign of fatigue, not a reversal signal.
- MACD: It has gone flat since early September and is now crossing slightly below its signal line. This is a minor bearish crossover at a very shallow slope, consistent with consolidation rather than a trend change.
- ADX and DI: ADX is hovering around 20 while −DI just crossed above +DI. Trend strength is insufficient for a decisive directional call.
- CMF: It has drifted from positive to zero, a mild loss of accumulation as price pushes toward $350.
- Price versus long-term averages: Price is about 16% above the 200D SMA and well above VWAP, so it is extended. That raises the odds of a mean-reversion pullback toward the $333 cluster, but a pullback there would still be a trend-consistent higher low.
- Trend: The structure since August is a series of higher highs and higher lows in a rising channel, with the EMA 21 acting as the dip-buying line.
CHART PATTERNS
- Consolidation under resistance (Ascending Triangle / Bullish Flag-like): Price has traded in a tight $339-$349 band for about two weeks under a flat resistance zone near $349-$351. It holds above a rising EMA 21 and 50D SMA, which is an ascending-triangle-like or bullish-flag-like continuation setup. A close above about $351, on rising volume, would target roughly $355-$365 (the prior wick highs near $355 and the measured move of the prior leg).
- Bearish Rising Wedge risk: The broader August-October advance is a rising channel with narrowing momentum (RSI divergence). A decisive break below the EMA 55 and 50D SMA near $333 would turn this into a rising wedge breakdown, targeting the $315-$320 area.
- Pattern bias: The continuation patterns carry more weight because the larger trend and MA stack are bullish.
POTENTIAL SCENARIOS
- Scenario 1: Bullish Breakout and Trend Continuation — Price holds the EMA 21 / $340 zone, then breaks the $349-$351 resistance cluster as the ascending-triangle-like consolidation resolves upward. Trend structure and the stacked moving averages support the move, though ADX needs to rise above 25 to confirm. Trigger: daily close above $351 on above-average volume, with MACD recrossing above signal. Target: $355-$365. Invalidation: daily close below $333. (50% probability)
- Scenario 2: Neutral Range-Bound Consolidation — With ADX below 20, CMF at zero and RSI mid-range, price keeps chopping between the EMA 55 / 50D SMA support and the upper Bollinger band. Trigger: repeated failures near $350 and bounces off $336-$340. Target: $335-$350. Invalidation: a close outside $333-$351. (25% probability)
- Scenario 3: Bearish Pullback to the Moving Average Cluster — Fading momentum (the RSI divergence, the MACD cross-under, −DI above +DI) triggers a deeper correction toward the 50D SMA and below. Trigger: close below $333, which would break the EMA 55, 50D SMA and lower Bollinger band together. Target: $318-$322 (then the gap toward the $300 VWAP and 200D SMA zone if it extends). Invalidation: reclaim of $342 (EMA 21). (25% probability)
PRICE TARGETS
Timeframe: 48 days (target date Dec 19, 2026). The expected range width is $50 (about 14.5% of the current price), in line with the 30-60 day guidance of 12-18%. The ATR of $6.88 scaled over 48 days supports a range of this size.
- Target Price: $354.00 (48-day)
- Expected Range: $322.00 to $372.00
- Key Levels: Support at $333.04 (50D SMA / EMA 55 / lower Bollinger band cluster), Resistance at $350.89 (upper Bollinger band and the recent consolidation high)
OVERALL BIAS
OVERALL BIAS: BULLISH - Price is in a long-term uptrend, above all moving averages with an established golden cross, and is consolidating just beneath resistance in a continuation-style structure. Short-term momentum (MACD slightly under signal, −DI above +DI, CMF at zero, RSI divergence) argues for choppiness and a possible dip toward $333, but the evidence favors a modest upside resolution by mid-December.
This is educational analysis and not financial advice.