AMZN 48-day bearish forecast — Nov 1, 2026
- Bias: Bearish
- Timeframe: 48 days (made Nov 1, 2026, target date Dec 18, 2026)
- Price at analysis: $240.35
- Price target: $233.00
- Expected range: $217.00 – $253.00
- Result: Pending — graded after the close on Dec 18, 2026
Get a free AI analysis of AMZN today
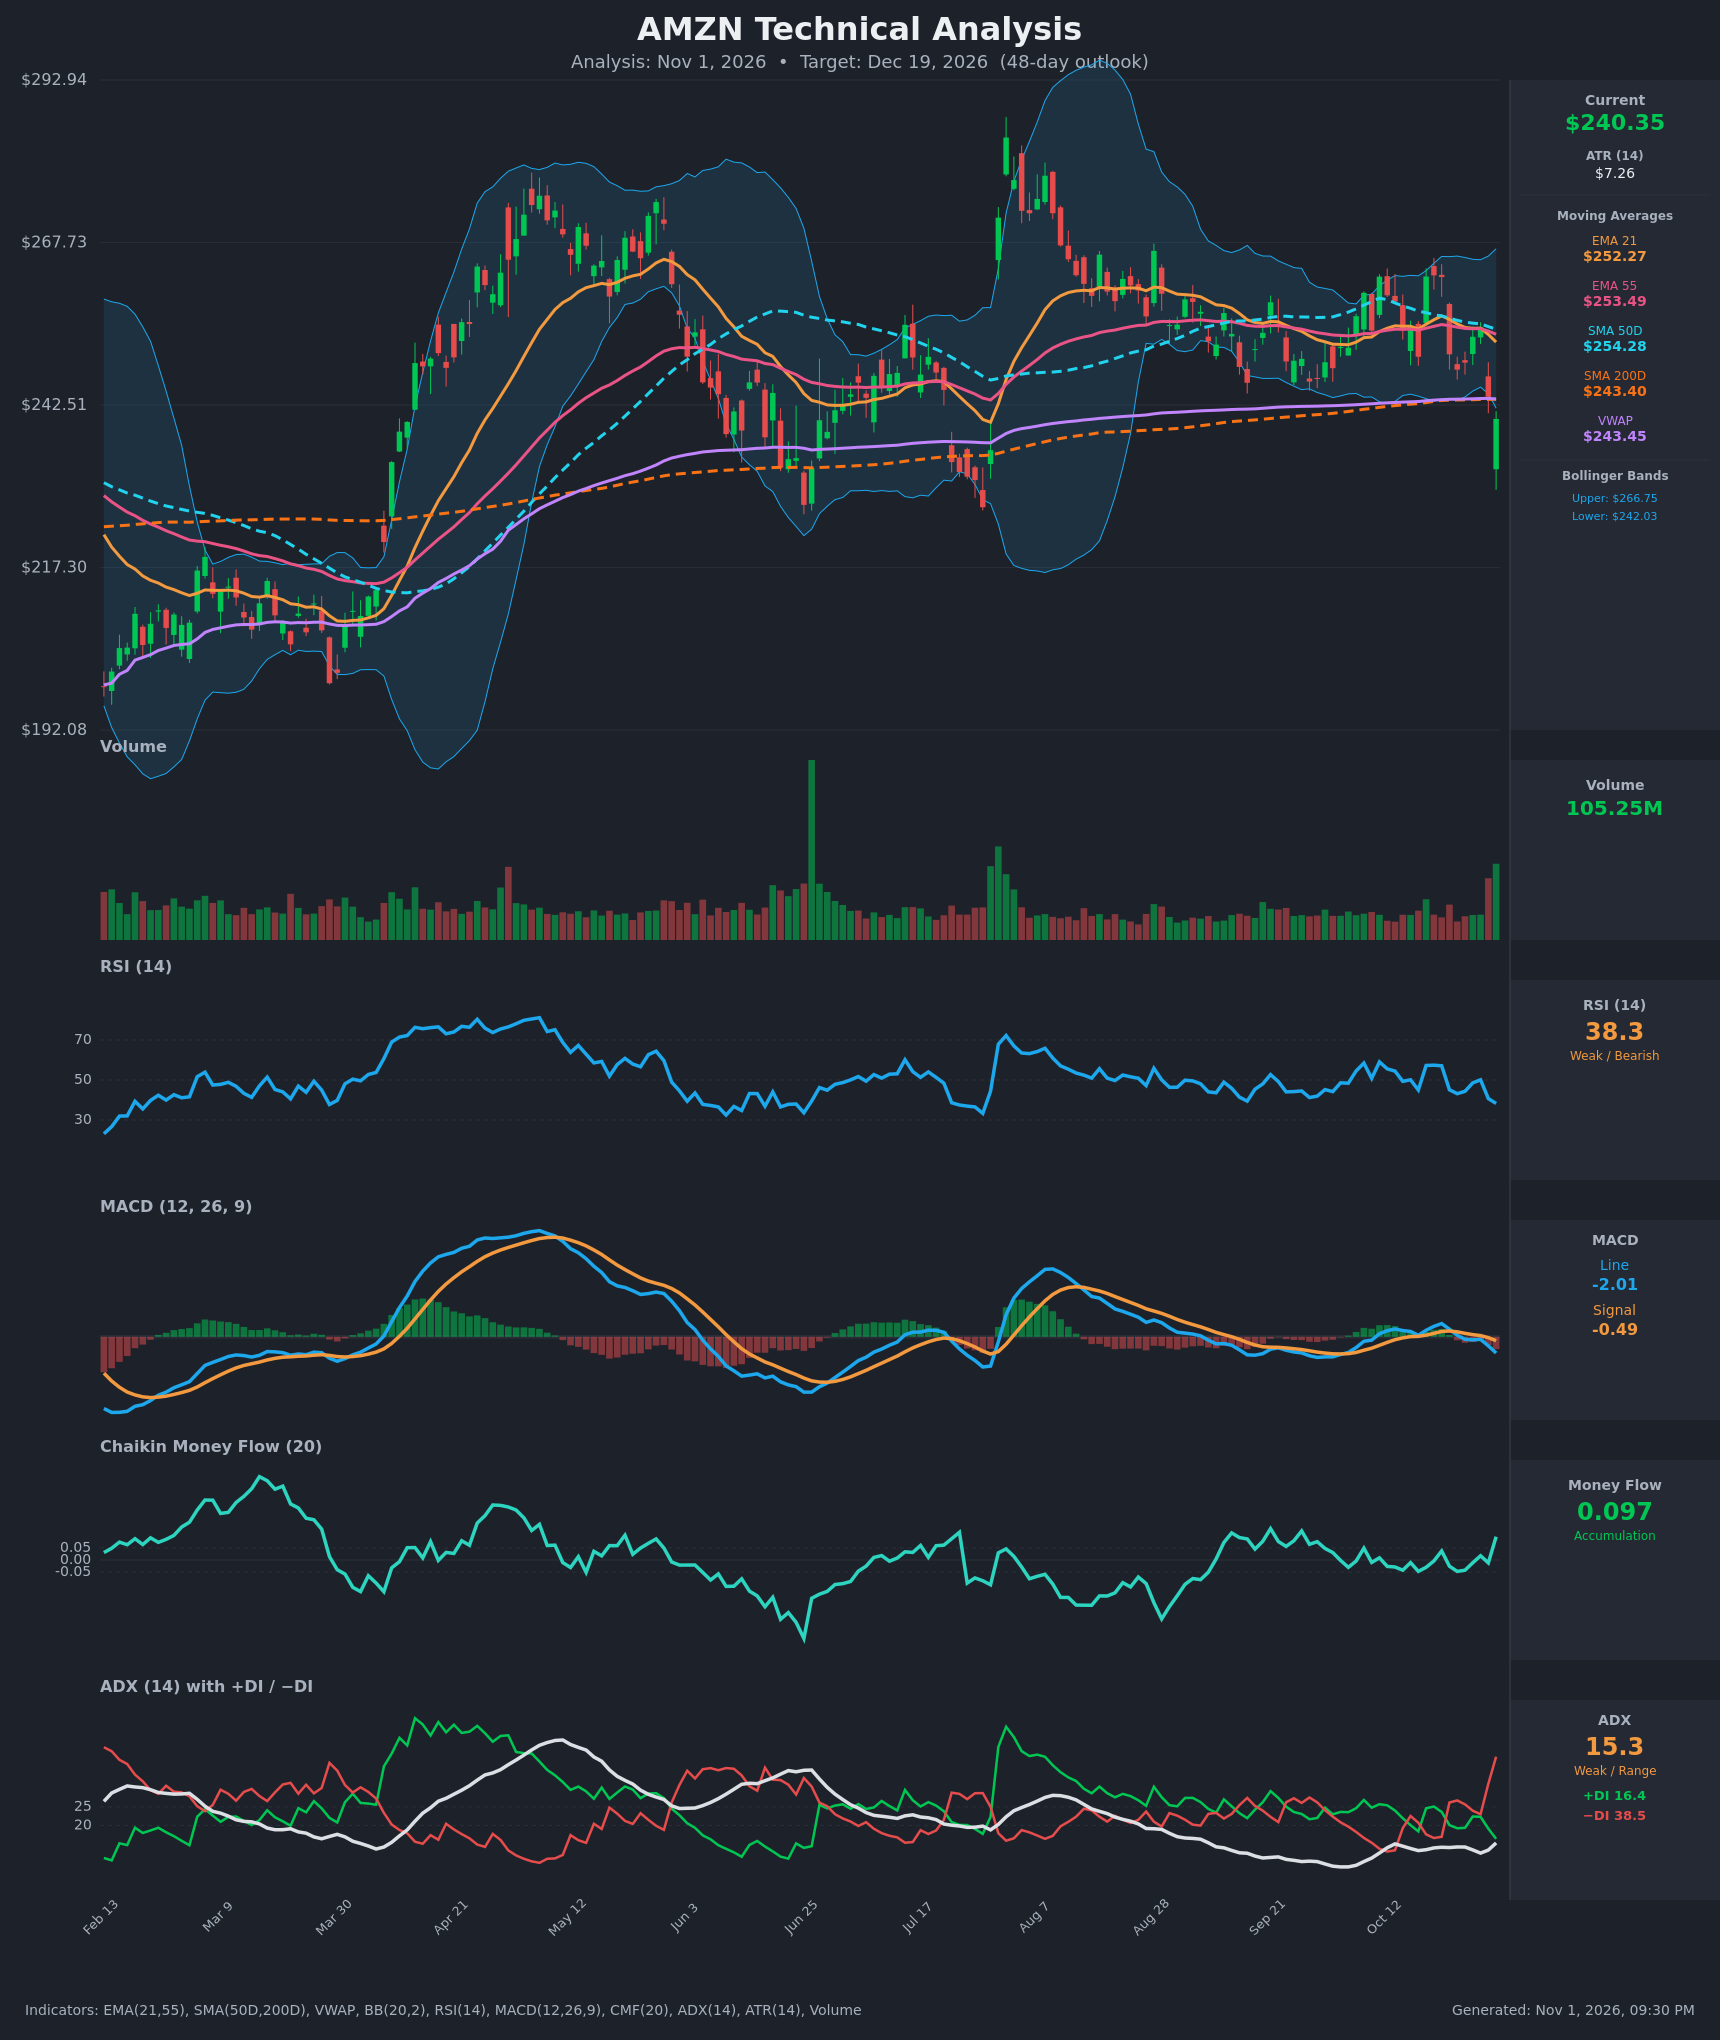
Analysis
TECHNICAL INDICATORS
- RSI (14): 38.26, down from 50.1 on Oct 28 and 57 on Oct 19-21. It is falling toward oversold but not there yet, so there is room for more downside. [Bearish]
- 20 EMA: The supplied value is the EMA 21 at $252.27, with EMA 55 at $253.49. Price at $240.35 is about 4.7% below the EMA 21, which is now overhead resistance. EMA21 crossed below EMA55 on Oct 29, a bearish crossover. [Bearish]
- MACD: The line is -2.01 against a signal of -0.49, a bearish crossover on Oct 29 that has widened since. The histogram is negative and expanding, so momentum is falling. [Bearish]
- Bollinger Bands (20): Price at $240.35 is below the lower band ($242.03) after a large gap-down candle. The bands are fairly narrow (upper $266.75), reflecting the sideways range since August. A close below the lower band signals a bearish breakout, though it can also lead to a snap-back toward the midline (about $254). [Bearish]
- CMF (20): +0.097, above the +0.05 threshold, and it jumped from -0.012 to +0.097 on the latest bar. This is an unusual divergence: it may reflect closes in the upper part of the bar's range or dip buying, but it conflicts with the price drop. [Accumulation]
- ADX (14): 15.3, which is weak and range-bound, but it is turning up from 12.6. −DI (38.5) is far above +DI (16.4), so bears control the short-term direction. The trend is not yet strong, but the new selling is directional. [Weak Trend, Bearish direction]
- Volume: 105.25M on the latest bar, one of the highest of the recent period, on a large red gap-down candle. Heavy volume on a breakdown confirms the move; it could also be capitulation. [Bearish, confirms the selloff]
DIVERGENCES & TRENDS
- CMF vs. price: CMF turned positive (+0.097) while price fell about 7% in two sessions. This is a mild bullish divergence, but one reading is not enough to trust it.
- Moving averages: Price is below the EMA 21, EMA 55 and SMA 50 (254.28), and just below the SMA 200 ($243.40) and VWAP ($243.45). A loss of the SMA 200 is a significant technical break after months of holding it as support. The SMA50 is still above the SMA200, so the golden cross remains in place, but the gap has narrowed to about $11.
- MACD and RSI: The MACD has been drifting lower since the Oct 21 peak (1.64 to -2.01), and RSI has fallen from 57 to 38. Both confirm weakening momentum.
- DI crossover: −DI crossed above +DI on Oct 14-15 and again on Oct 22. The gap has now widened sharply (38.5 vs 16.4), a bearish trend-direction signal.
- Low ADX: ADX remains below 20, so follow-through is uncertain and a snap-back to the $243-$250 area is plausible.
CHART PATTERNS
- Range breakdown, similar to the Bearish Triple Top and Double Top from the reference: Since early August, price has oscillated in a roughly $245-$265 band with repeated rejections near $262-$265. The latest gap-down is a break of the range floor (about $245), which is a bearish reversal or continuation structure. The measured move is about $20 (range height) below $245, giving about $225. That also lines up with the July and June swing lows near $225-$230.
- Not a clean pattern: The rectangle is loosely defined, so treat the measured move as a guide rather than a certainty.
- Retest risk: A pullback to the broken SMA 200/VWAP zone ($243.40-$243.45) from below is the classic retest, and a rejection there would confirm the breakdown.
POTENTIAL SCENARIOS
- Scenario 1: Bearish Range Breakdown Continuation — Price retests the $243-$246 zone (SMA 200/VWAP and the broken range floor), is rejected, and drifts lower toward the prior swing lows. −DI dominance, a negative MACD and the high-volume gap support this. Trigger: failure to reclaim $243.45 on a closing basis, or a daily close below $236. Target: $225-$233. Invalidation: daily close above $254 (EMA 55/SMA 50). (50% probability)
- Scenario 2: Bullish Snap-Back Recovery — The close below the lower Bollinger Band and the CMF divergence trigger a mean-reversion bounce back into the old range, re-establishing the $245-$260 band. Trigger: reclaim of $243.45 followed by $247. Target: $250-$256. Invalidation: close below $232. (30% probability)
- Scenario 3: Neutral Choppy Basing — Price consolidates around the $230-$248 zone, with ADX staying weak (<20) as buyers and sellers balance. Trigger: repeated closes between $232 and $247. Target: $238-$244. Invalidation: close outside the $230-$250 range. (20% probability)
PRICE TARGETS
- Target Price: $233.00 (48-day target)
- Expected Range: $217.00 to $253.00 (width $36, or about 15% of the current price, in line with the 30-60 day guidance)
- Key Levels: Support at $226.00, Resistance at $243.40
OVERALL BIAS
OVERALL BIAS: BEARISH - Price has broken below its multi-month range floor, the lower Bollinger Band, the SMA 200, VWAP and all key EMAs on heavy volume, with a bearish MACD crossover and −DI far above +DI. The positive CMF and low ADX argue for a possible bounce, but the weight of evidence favors a drift toward the $225-$233 swing lows.
This is educational analysis and not financial advice.