F 48-day bullish forecast — Nov 1, 2026
- Bias: Bullish
- Timeframe: 48 days (made Nov 1, 2026, target date Dec 18, 2026)
- Price at analysis: $12.25
- Price target: $12.70
- Expected range: $11.65 – $13.50
- Result: Pending — graded after the close on Dec 18, 2026
Get a free AI analysis of F today
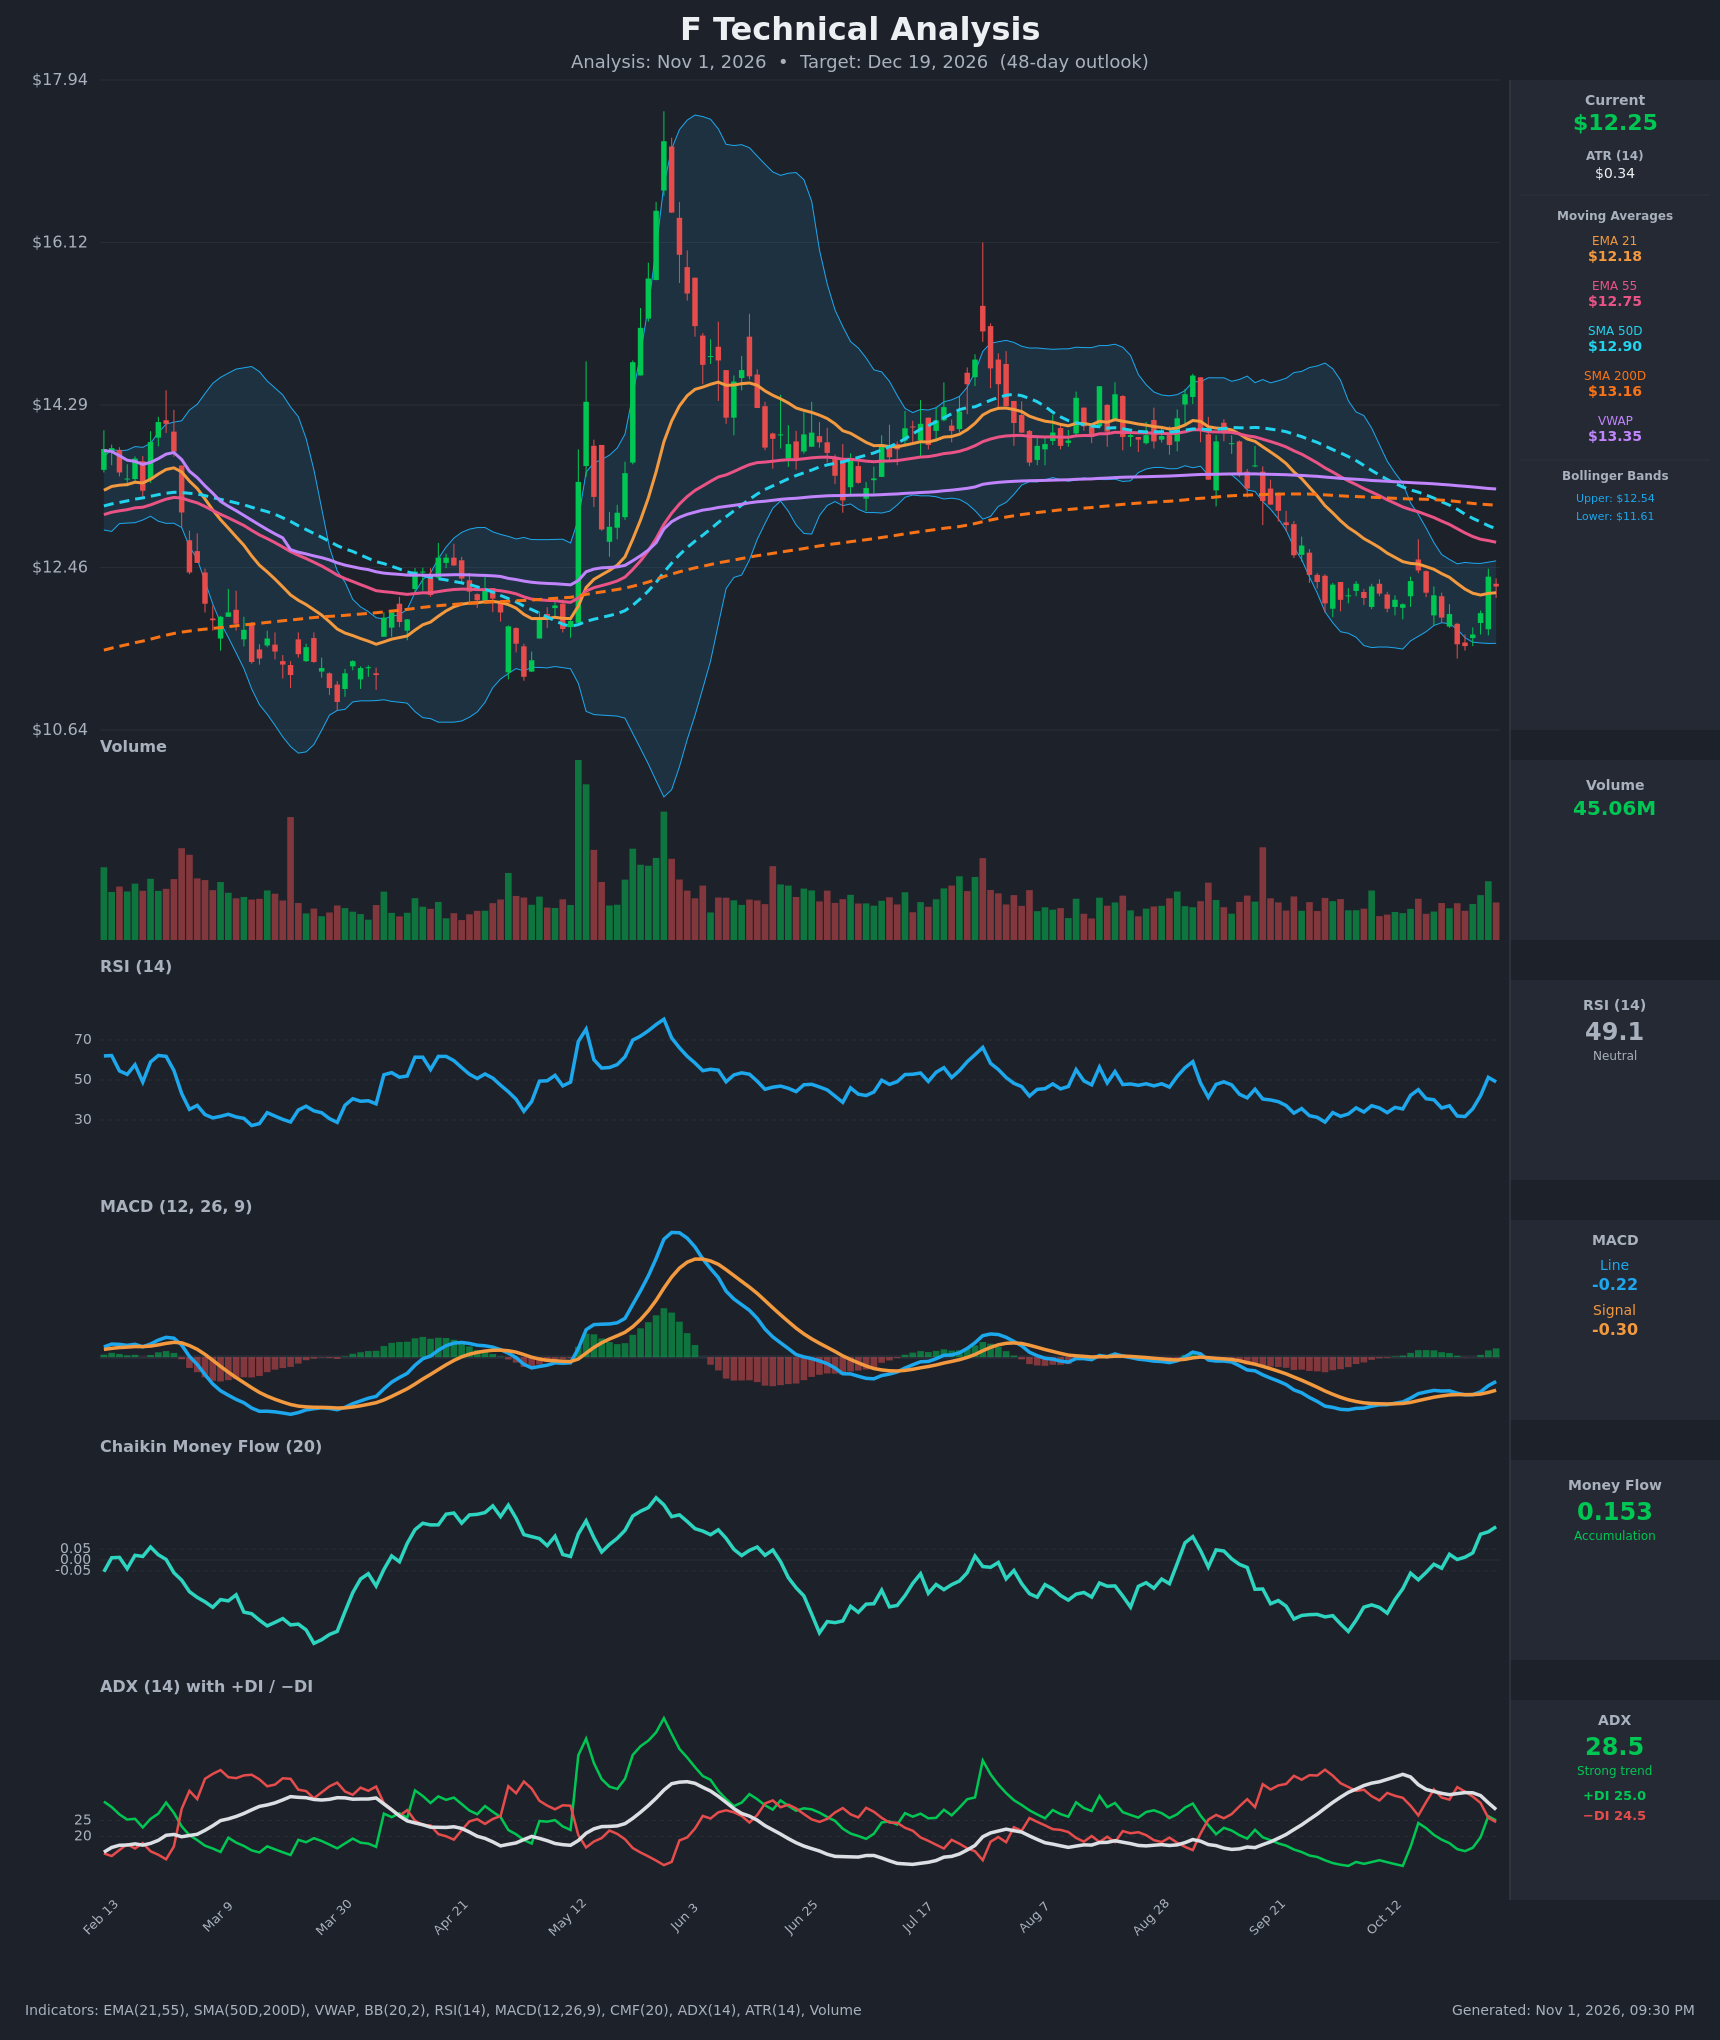
Analysis
TECHNICAL INDICATORS
- RSI (14): 49.07, up sharply from the 31.7 low on Oct 26 and now back at the midline. It briefly touched 51.3 and has pulled back slightly. Momentum has recovered from oversold but is not yet clearly bullish. [Neutral]
- 20 EMA (EMA 21 = $12.18): Price at $12.25 is just above the EMA21, which has flattened after a steep decline. The EMA21 is still below the EMA55 ($12.75), so the medium-term structure remains bearish. [Neutral]
- MACD: The line is -0.223 against a signal of -0.302. The line is rising and the histogram has turned positive (about +0.08). It has not yet crossed above zero, so this is an early recovery signal below the zero line. [Bullish]
- Bollinger Bands (20): The bands run from $11.61 to $12.54, with the midline near $12.07. Price is in the upper half after bouncing off the lower band, with room toward $12.54. The bands are fairly narrow, which suggests a volatility expansion is coming. [Neutral]
- CMF (20): 0.153, which is above the +0.05 threshold. It has risen steadily from about -0.25 in mid-October, showing real accumulation during the selloff and bounce. [Accumulation]
- ADX (14): 28.5 and falling from 39.5. +DI is 25.0 and −DI is 24.5, so the DIs have almost converged after a bullish crossover on Oct 29. The prior downtrend is losing strength, but no new trend has been established. [Fading Strong Trend, direction undecided]
- Volume: 45.06M, with the last bounce candle on above-average volume. Selling volume dried up near the lows, which is constructive, but volume is still modest compared with the May spike. [Mildly Bullish]
DIVERGENCES & TRENDS
- Bullish divergence: Price made a lower low around $11.58 on Oct 26, while CMF turned positive and rose. RSI and MACD held well above their earlier lows from the spring.
- Moving average structure is bearish:
- Price is below the EMA55 ($12.75), SMA50 ($12.90), SMA200 ($13.16) and VWAP ($13.35).
- The SMA50 is under the SMA200 (about $12.90 vs $13.16), so the death cross has already happened.
- The EMA21 is under the EMA55.
- Crossovers: The DI crossover (+DI over −DI) on Oct 29 and the MACD histogram flip are early positive signs. A true MACD line/signal crossover has not yet occurred.
- Trend: ADX peaked near 39 on the downtrend and is now rolling over, which points to trend exhaustion and a possible base.
CHART PATTERNS
- Possible Bullish Double Bottom:
- The Oct 23 and Oct 26 lows at about $11.58–$11.60 form the two bottoms, with a neckline around $12.40–$12.45 (the Oct 16 and Oct 29 highs).
- A close above the neckline would project a measured move of roughly $0.85, to about $13.25.
- The pattern is not yet confirmed, and the neckline is untested.
- Prior breakdown: The late-September breakdown from the $13.5–$14.0 range created heavy overhead supply at $12.75–$13.35, where the EMA55, SMA50, SMA200 and VWAP cluster. This caps the upside.
- Possible Symmetrical Triangle (low confidence): Price is compressing around $11.60–$12.45 with ADX fading. A breakout in either direction is possible.
POTENTIAL SCENARIOS
- Scenario 1: Bullish Double-Bottom Recovery — Price breaks the $12.45 neckline, retests it, and grinds up into the moving average cluster, supported by CMF accumulation and a MACD cross above zero. Trigger: daily close above $12.45 with MACD crossing above its signal. Target: $12.75–$13.20 (EMA55 to SMA200). Invalidation: close below $11.58. (45% probability)
- Scenario 2: Bearish Rejection at Resistance — The bounce stalls near the EMA55/SMA50 ($12.75–$12.90) and rolls over. Price resumes the downtrend because it is below all the long-term averages, with the death cross in place. Trigger: rejection at $12.5–$12.9 and a loss of the EMA21 ($12.18). Target: $11.60, then $11.20. Invalidation: sustained close above $13.00. (35% probability)
- Scenario 3: Neutral Range Chop — Price stays between $11.60 and $12.75 as ADX continues to fall. Trigger: failure to break either side with falling volume. Target: $12.00–$12.50. Invalidation: close outside the $11.55–$12.90 band. (20% probability)
PRICE TARGETS
- Target Price: $12.70 (48 days, Dec 19, 2026)
- Expected Range: $11.65 to $13.50 (width $1.85, about 15% of current price, consistent with the 30–60 day guidance)
- Key Levels: Support at $11.60, Resistance at $12.90
OVERALL BIAS
OVERALL BIAS: BULLISH - CMF accumulation (0.153), a rising MACD with a positive histogram, RSI recovering from oversold, and a possible double bottom at $11.58–$11.60 favor a recovery toward the EMA55/SMA50 zone. Gains are likely capped near $12.75–$13.20 by overhead moving-average resistance, so conviction is modest.
This is educational analysis and not financial advice.