IBIT 48-day bearish forecast — Nov 1, 2026
- Bias: Bearish
- Timeframe: 48 days (made Nov 1, 2026, target date Dec 18, 2026)
- Price at analysis: $43.36
- Price target: $41.20
- Expected range: $37.60 – $45.10
- Result: Pending — graded after the close on Dec 18, 2026
Get a free AI analysis of IBIT today
Analysis
TECHNICAL INDICATORS
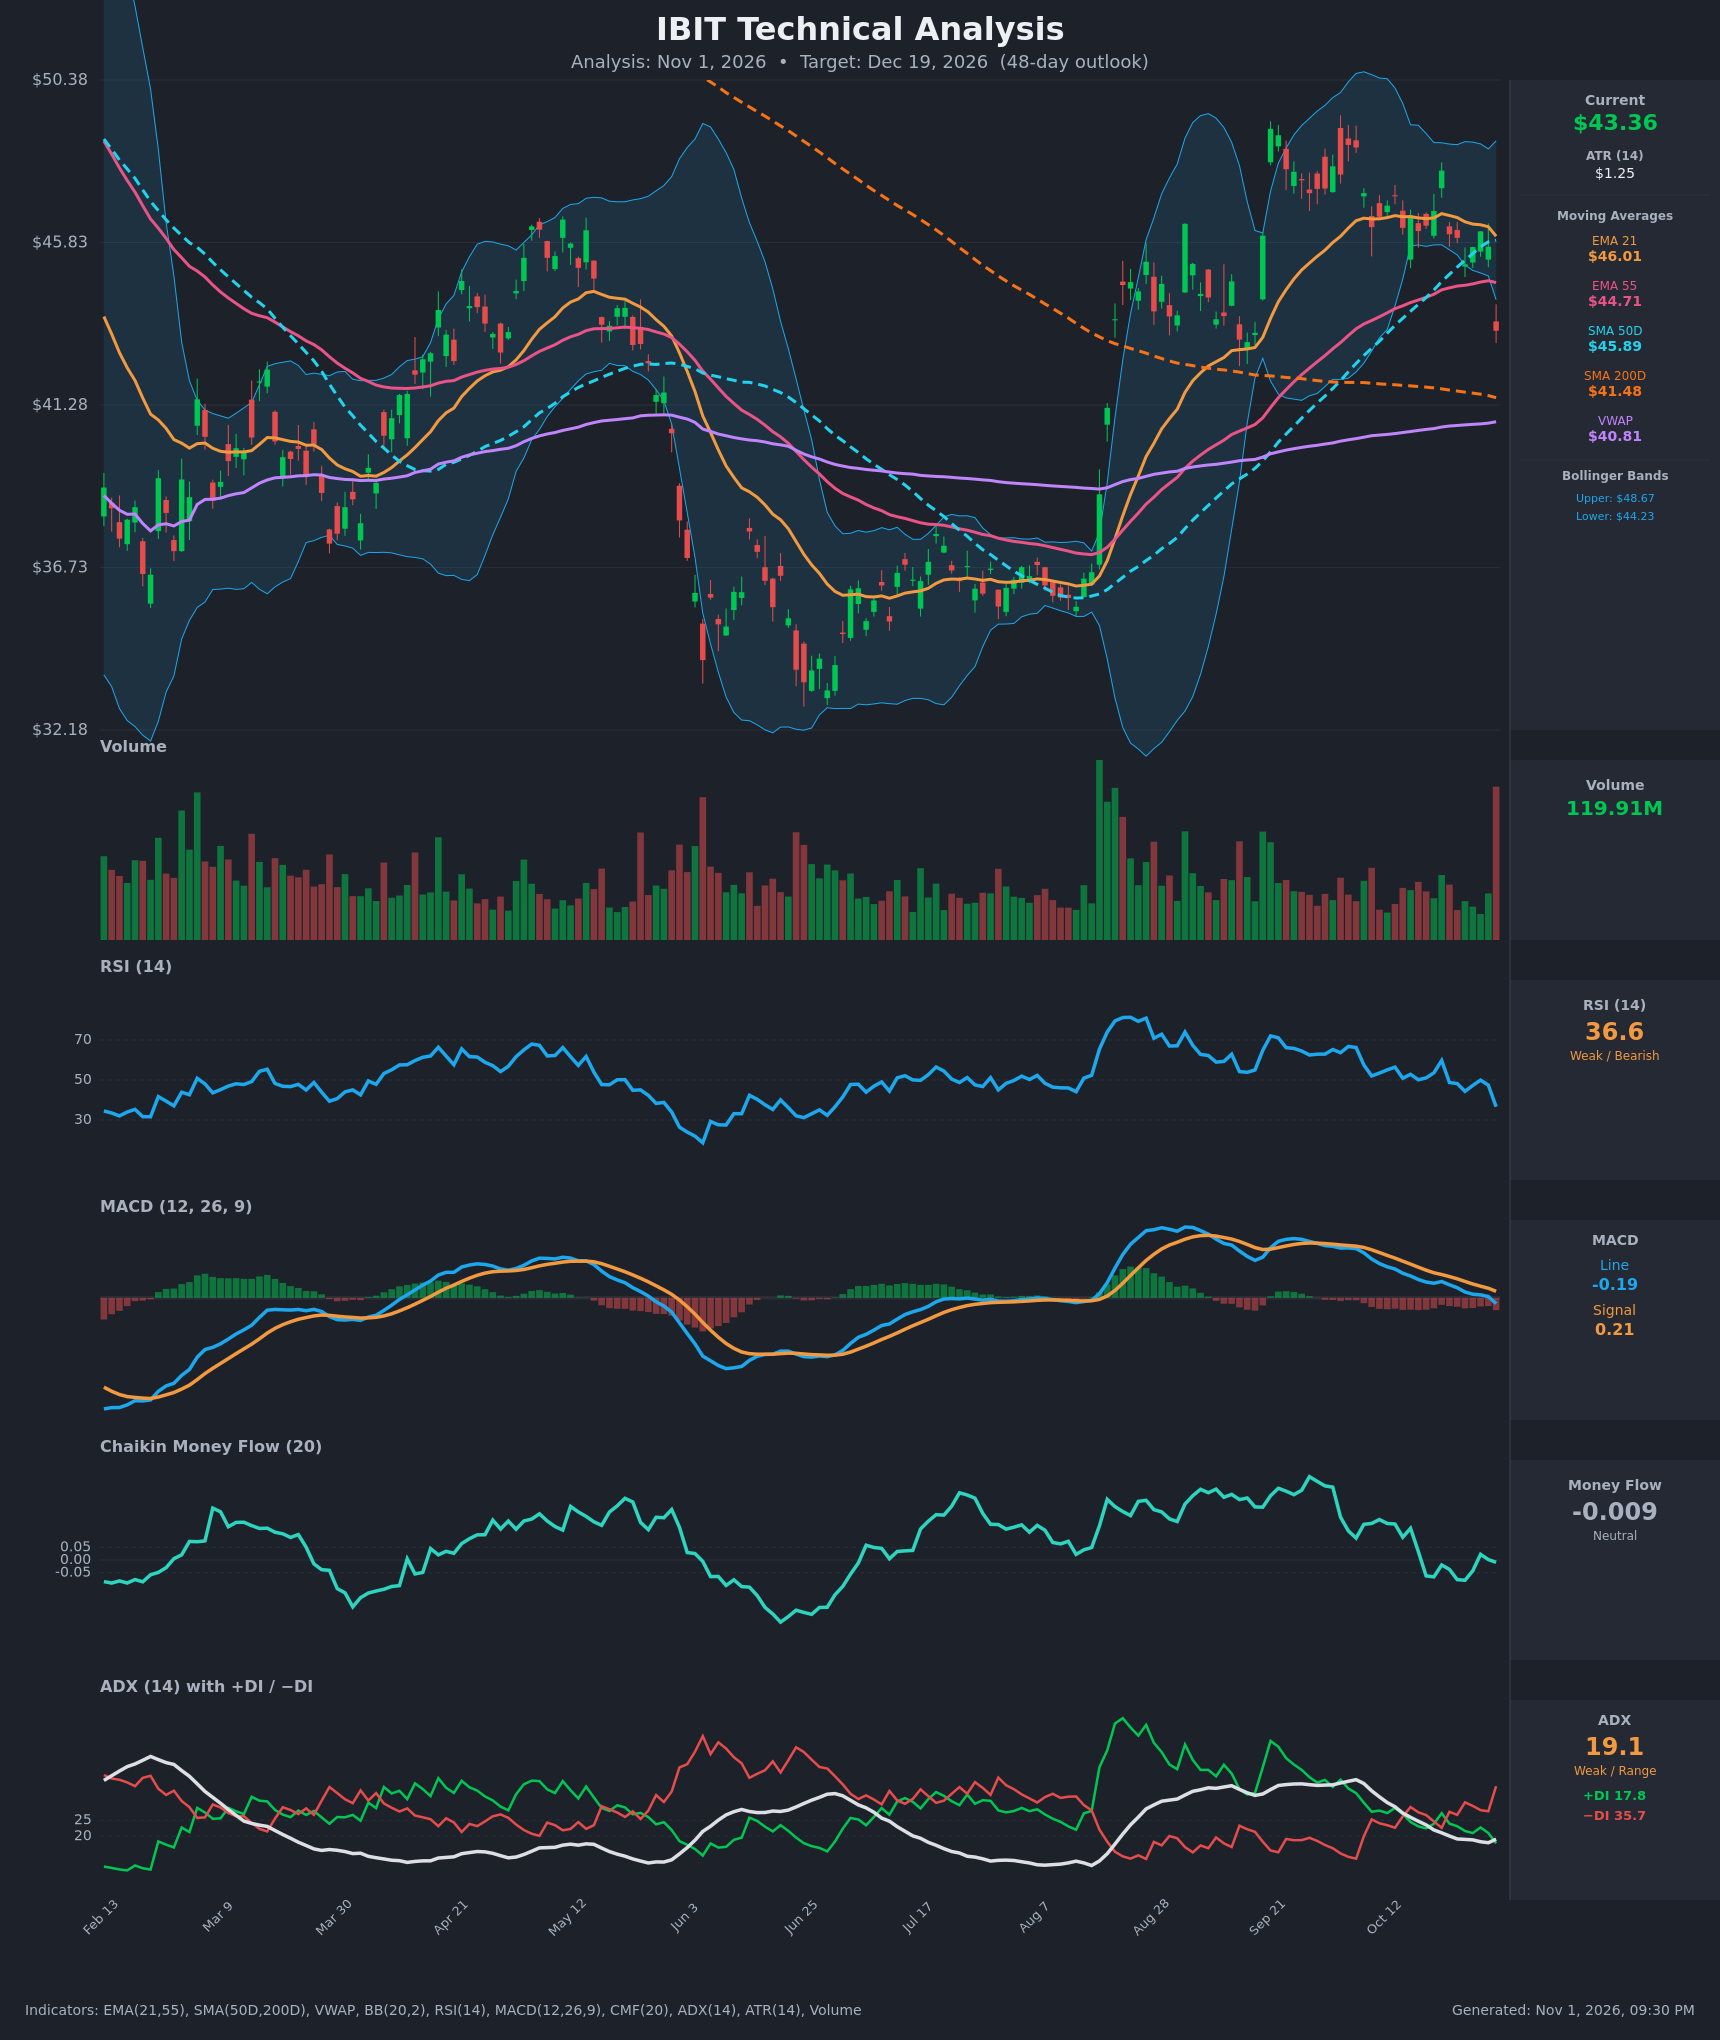
- RSI (14): 36.64, down sharply from about 47–50 a few bars ago and approaching oversold (<30) without reaching it. Momentum is clearly weakening. [Bearish]
- 20 EMA: The 21 EMA is $46.01 and price at $43.36 is about 5.8% below it, so it is now overhead resistance. The EMA has started to roll over from its $46.64 peak. [Bearish]
- MACD: The line (-0.188) just crossed below the signal (0.208), and the histogram is negative and expanding. This is a fresh bearish crossover. [Bearish]
- Bollinger Bands (20): Price at $43.36 is below the lower band ($44.23) and the upper band is $48.67. The bands have narrowed, and a close outside the lower band signals a strong downside impulse. Some mean-reversion bounce risk is likely. [Bearish]
- CMF (20): -0.009 is in the neutral zone. It has faded from +0.14 in mid-October, which shows buying pressure disappearing, but there is not yet distribution. [Neutral]
- ADX (14): 19.1 (weak or range-bound) with −DI 35.7 well above +DI 17.8. The trend is not yet established, but the DI spread is widening bearishly. [Weak Trend, Bearish Direction]
- Volume: 119.91M, the highest bar on the chart, on a large red candle (-5.1%). High-volume selling suggests a distribution or breakdown move. [Bearish]
DIVERGENCES & TRENDS
- No bullish divergence is present. RSI and MACD are making lower highs and lower lows alongside price.
- MACD histogram turned negative in mid-October, and the bearish signal crossover has now been confirmed.
- The 21 EMA ($46.01) has flattened and is turning down, and the SMA50D ($45.89) is still rising but is about to be caught by it. A close below the 55 EMA ($44.71) is a bearish break of medium-term trend support.
- Price broke below both the 55 EMA ($44.71) and the SMA50D ($45.89) in one session.
- SMA200D ($41.48) is rising slightly and sits below price, so the long-term trend remains intact. It is the main downside support, together with the $40.81 VWAP.
- The −DI/+DI crossover to bearish (−DI above +DI since Oct 14) has persisted and widened.
- CMF has rolled over from strong accumulation (Aug–Sep) to neutral.
CHART PATTERNS
- Since the September high near $48–49, price has made lower highs, forming a Bearish Head and Shoulders / Double Top-like structure with a neckline near $45–46 (the $45.2–46 zone, now broken).
- The October consolidation between $45 and $47.8 resembles a Bearish Flag/Pennant, and the breakdown on heavy volume resolves it to the downside.
- The measured move from the range (about $2.5–3) points to about $40.5–41, which aligns with the SMA200D ($41.48) and VWAP ($40.81).
- Pattern confidence is moderate. ADX is low, so a failed breakdown back into the $45–46 range is possible.
POTENTIAL SCENARIOS
- Scenario 1: Bearish Breakdown Continuation — The high-volume break below the 55 EMA and SMA50D, combined with the MACD cross and −DI dominance, suggests a drift toward the 200-day and VWAP zone. Trigger: daily closes below $43.00. Target: $40.50–$41.50. Invalidation: daily close above $45.90 (SMA50D). (50% probability)
- Scenario 2: Neutral Oversold Bounce and Range — RSI near 30 and a close below the lower Bollinger Band prompt a relief bounce into the $44.7–46 resistance cluster, followed by chop. Trigger: hold above $42.50 and reclaim $44.70. Target: $44.50–$46.00. Invalidation: close below $41.50. (30% probability)
- Scenario 3: Bearish Deeper Correction — Support at the 200-day fails and price extends to the prior consolidation low. Trigger: close below $41.00 on rising volume. Target: $37.50–$38.50. Invalidation: reclaim of $44.70. (20% probability)
PRICE TARGETS
For a 48-day horizon, the expected range width should be about 12–18% of the current price, which is roughly $5.20–$7.80. I use a width of about $7.50.
- Target Price: $41.20 (48 days, about 5% below current, near the SMA200D and VWAP confluence)
- Expected Range: $37.60 to $45.10 (width $7.50, about 17.3% of the current price)
- Key Levels: Support at $41.48 (SMA200D), Resistance at $44.71 (55 EMA)
OVERALL BIAS
OVERALL BIAS: BEARISH - Price broke below the 55 EMA and SMA50D and closed below the lower Bollinger Band on the highest volume of the period, with a fresh bearish MACD crossover, −DI dominance, and falling RSI. The most likely path is a drift toward the SMA200D/VWAP zone near $41.
This is educational analysis and not financial advice.