DELL 48-day bearish forecast — Nov 1, 2026
- Bias: Bearish
- Timeframe: 48 days (made Nov 1, 2026, target date Dec 18, 2026)
- Price at analysis: $424.30
- Price target: $405.00
- Expected range: $372.00 – $442.00
- Result: Pending — graded after the close on Dec 18, 2026
Get a free AI analysis of DELL today
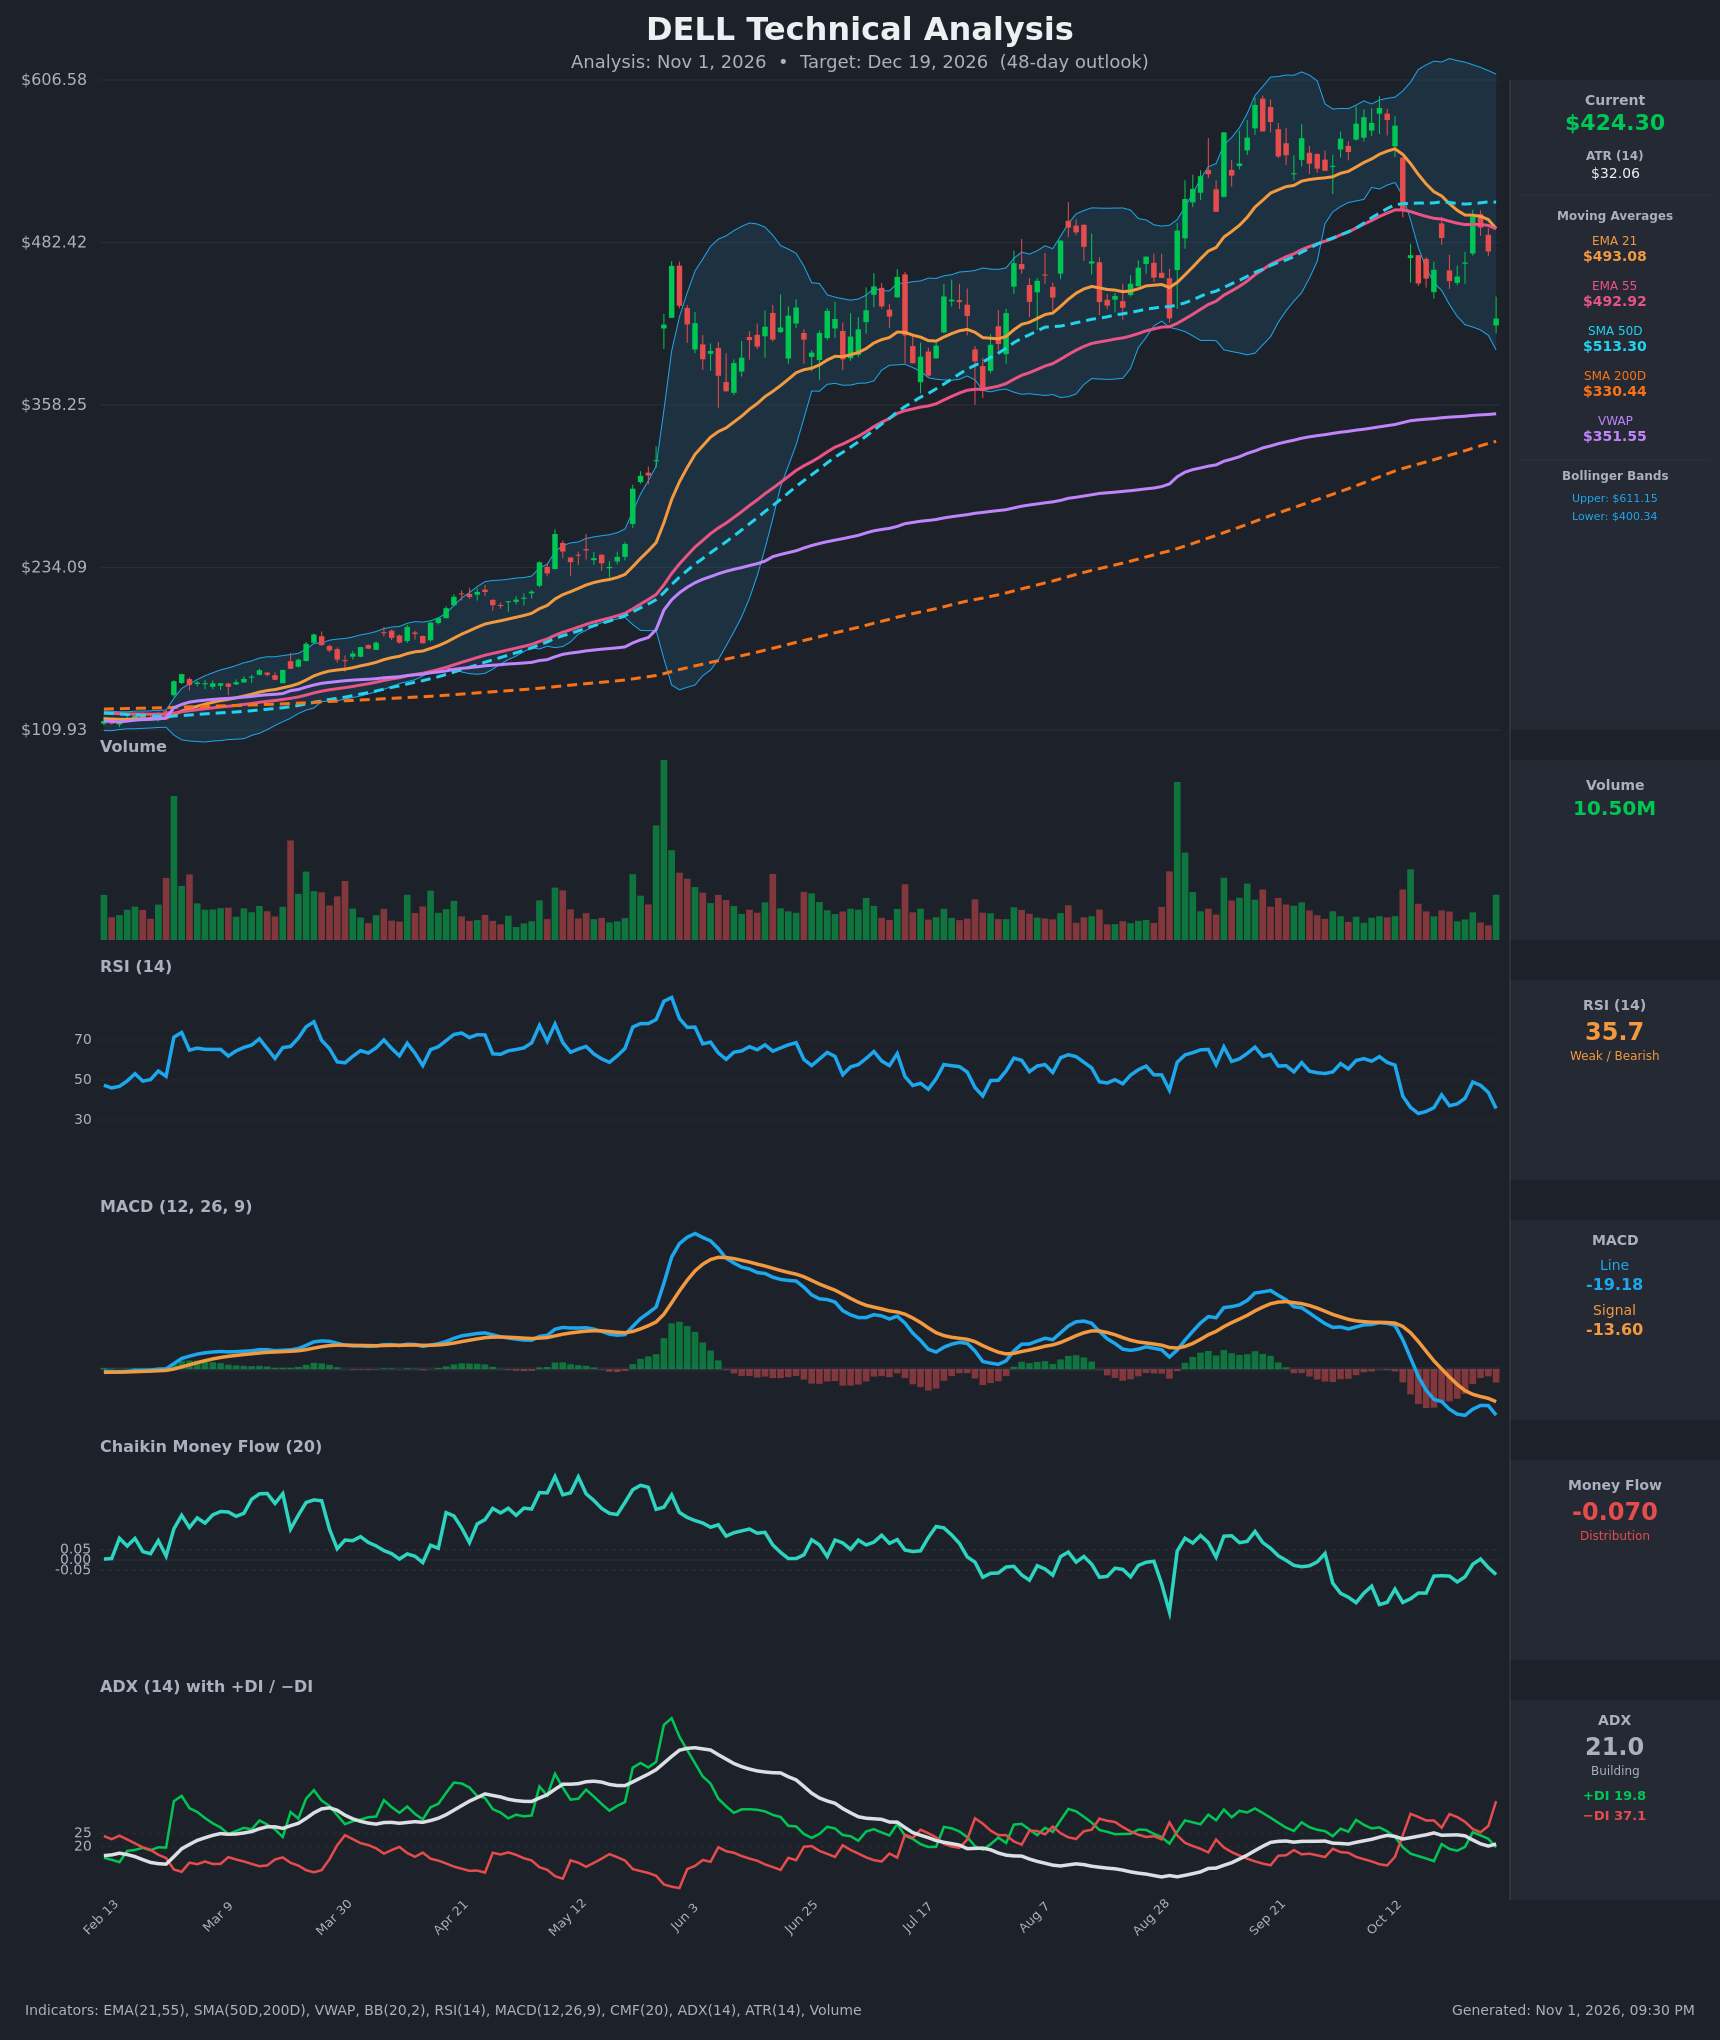
Analysis
TECHNICAL INDICATORS
- RSI (14): 35.74, down from 58.8 on Oct 12 and 49 on Oct 27. It is near the oversold zone but has not reached <30. Momentum is clearly weak, and the Oct 16 low of 33.2 was a recent floor. [Bearish]
- 20 EMA (EMA 21 = $493.08): Price at $424.30 is about 14% below it, so the EMA now acts as overhead resistance. It is rolling over from $553 and is about to cross below EMA 55 ($492.92), a bearish crossover in the making. [Bearish]
- MACD: Line -19.18 is below signal -13.60, with a negative and widening histogram. The bearish cross occurred around Oct 21, and the line just made a fresh low at -19.18, so momentum is re-accelerating down. [Bearish]
- Bollinger Bands (20): Upper $611.15, lower $400.34. The bands are wide, which reflects the recent volatility spike. Price is in the lower quarter of the band, about $24 (5.5%) above the lower band, after a sharp -10.8% drop on Oct 30. A band walk or a tag of $400 is possible. [Bearish]
- CMF (20): -0.070, below the -0.05 threshold. It slipped from +0.005 on Oct 28, and has been mostly negative since August, which is persistent distribution. [Distribution]
- ADX (14): 21.0 with −DI 37.1 far above +DI 19.8. ADX is only just turning up from about 20, so trend strength is still modest, but the directional bias is clearly bearish and −DI is spiking. [Weak-to-Building Trend, Bearish]
- Volume: 10.50M, a large bar relative to the quiet recent sessions. It came on a down close, which suggests institutional selling and a breakdown from the Oct range. [Bearish – heavy-volume selling]
DIVERGENCES & TRENDS
- There is no clear bullish RSI divergence. The Oct 16 RSI low was 33.2 and the current reading is 35.7 with price at a lower low ($424 vs $451). Price made a lower low while RSI stayed higher, so a mild bullish divergence is forming. It is unconfirmed and weak.
- The MACD is at a new low (-19.18), which confirms the price lower low. There is no divergence there.
- Price is below EMA 21, EMA 55 and SMA 50D ($513.30). It is still well above SMA 200D ($330.44) and VWAP ($351.55), so the long-term uptrend is intact but has been damaged.
- EMA 21 is about to cross below EMA 55. SMA 50D is far above SMA 200D, so there is no death cross, and none is possible within the horizon.
- Since Oct 14, closes have been a series of lower highs ($575 → $501 → $475), and the Oct 30 close broke below the Oct 16 low of $451. −DI has re-spiked above +DI (37 vs 20).
- CMF has been below zero since Aug despite price making highs in Sept/Oct, so selling pressure was building under the surface of the rally.
CHART PATTERNS
- Bearish top and breakdown: The Sept–Oct peak near $590 was followed by a sharp rollover. Price then traded in an $451–$502 range (a rectangle, similar to the Bearish Triple Top diagram) and has now broken below the range floor. The measured move is roughly the range height of about $50, which gives ~$400. That level coincides with the lower Bollinger Band at $400.34.
- Rebounds to $475–$500 have failed at the falling EMAs, which is consistent with bear-flag-style behaviour.
- A rebound would need to reclaim $451–$475 and then $493 to invalidate the breakdown.
POTENTIAL SCENARIOS
- Scenario 1: Bearish Range-Breakdown Continuation — Distribution, a bearish MACD and −DI dominance drive a measured move toward the lower band and beyond, with the EMA 21/55 bearish cross adding pressure. Trigger: daily close below $400 (lower BB) or failure to hold $410. Target: $400, then $375 and possibly the $350 area (VWAP $351) if selling accelerates. Invalidation: daily close above $475. (50% probability)
- Scenario 2: Bullish Oversold Bounce / Mean Reversion — RSI near 30, the mild bullish divergence and a tag of the lower band spark a relief rally back toward the declining EMAs. Trigger: reclaim of $451 on rising volume with the RSI above 45. Target: $475, with an extension to $493 (EMA 21/55 zone). Invalidation: close below $400. (35% probability)
- Scenario 3: Neutral Basing Range — Price chops between $395 and $450 as the sell-off digests and ADX stays near 20. Trigger: several closes inside $400–$450 with contracting volume. Target: about $425. Invalidation: close outside the $395–$455 band. (15% probability)
PRICE TARGETS
Timeframe: 48 days (Dec 19, 2026).
- Target Price: $405.00
- Expected Range: $372.00 to $442.00 (width $70 = 16.5% of the current price, consistent with the 30–60 day guidance of 12–18%)
- Key Levels: Support at $400.00 (lower Bollinger Band, measured-move target), Resistance at $475.00 (recent failed bounce high, below EMA 21/55 at about $493)
OVERALL BIAS
OVERALL BIAS: BEARISH - Price has broken below its $451 range floor on heavy volume. MACD is bearish, −DI (37) is far above +DI (20), CMF shows distribution, and price sits below the EMA 21/55 and SMA 50D, with a measured move pointing to about $400. Conviction is modest because RSI is near oversold, price is far above the SMA 200D, and a relief bounce is plausible.
This is educational analysis and not financial advice.