CRWV 48-day bearish forecast — Nov 1, 2026
- Bias: Bearish
- Timeframe: 48 days (made Nov 1, 2026, target date Dec 18, 2026)
- Price at analysis: $54.87
- Price target: $51.00
- Expected range: $46.50 – $56.00
- Result: Pending — graded after the close on Dec 18, 2026
Get a free AI analysis of CRWV today
Analysis
TECHNICAL INDICATORS
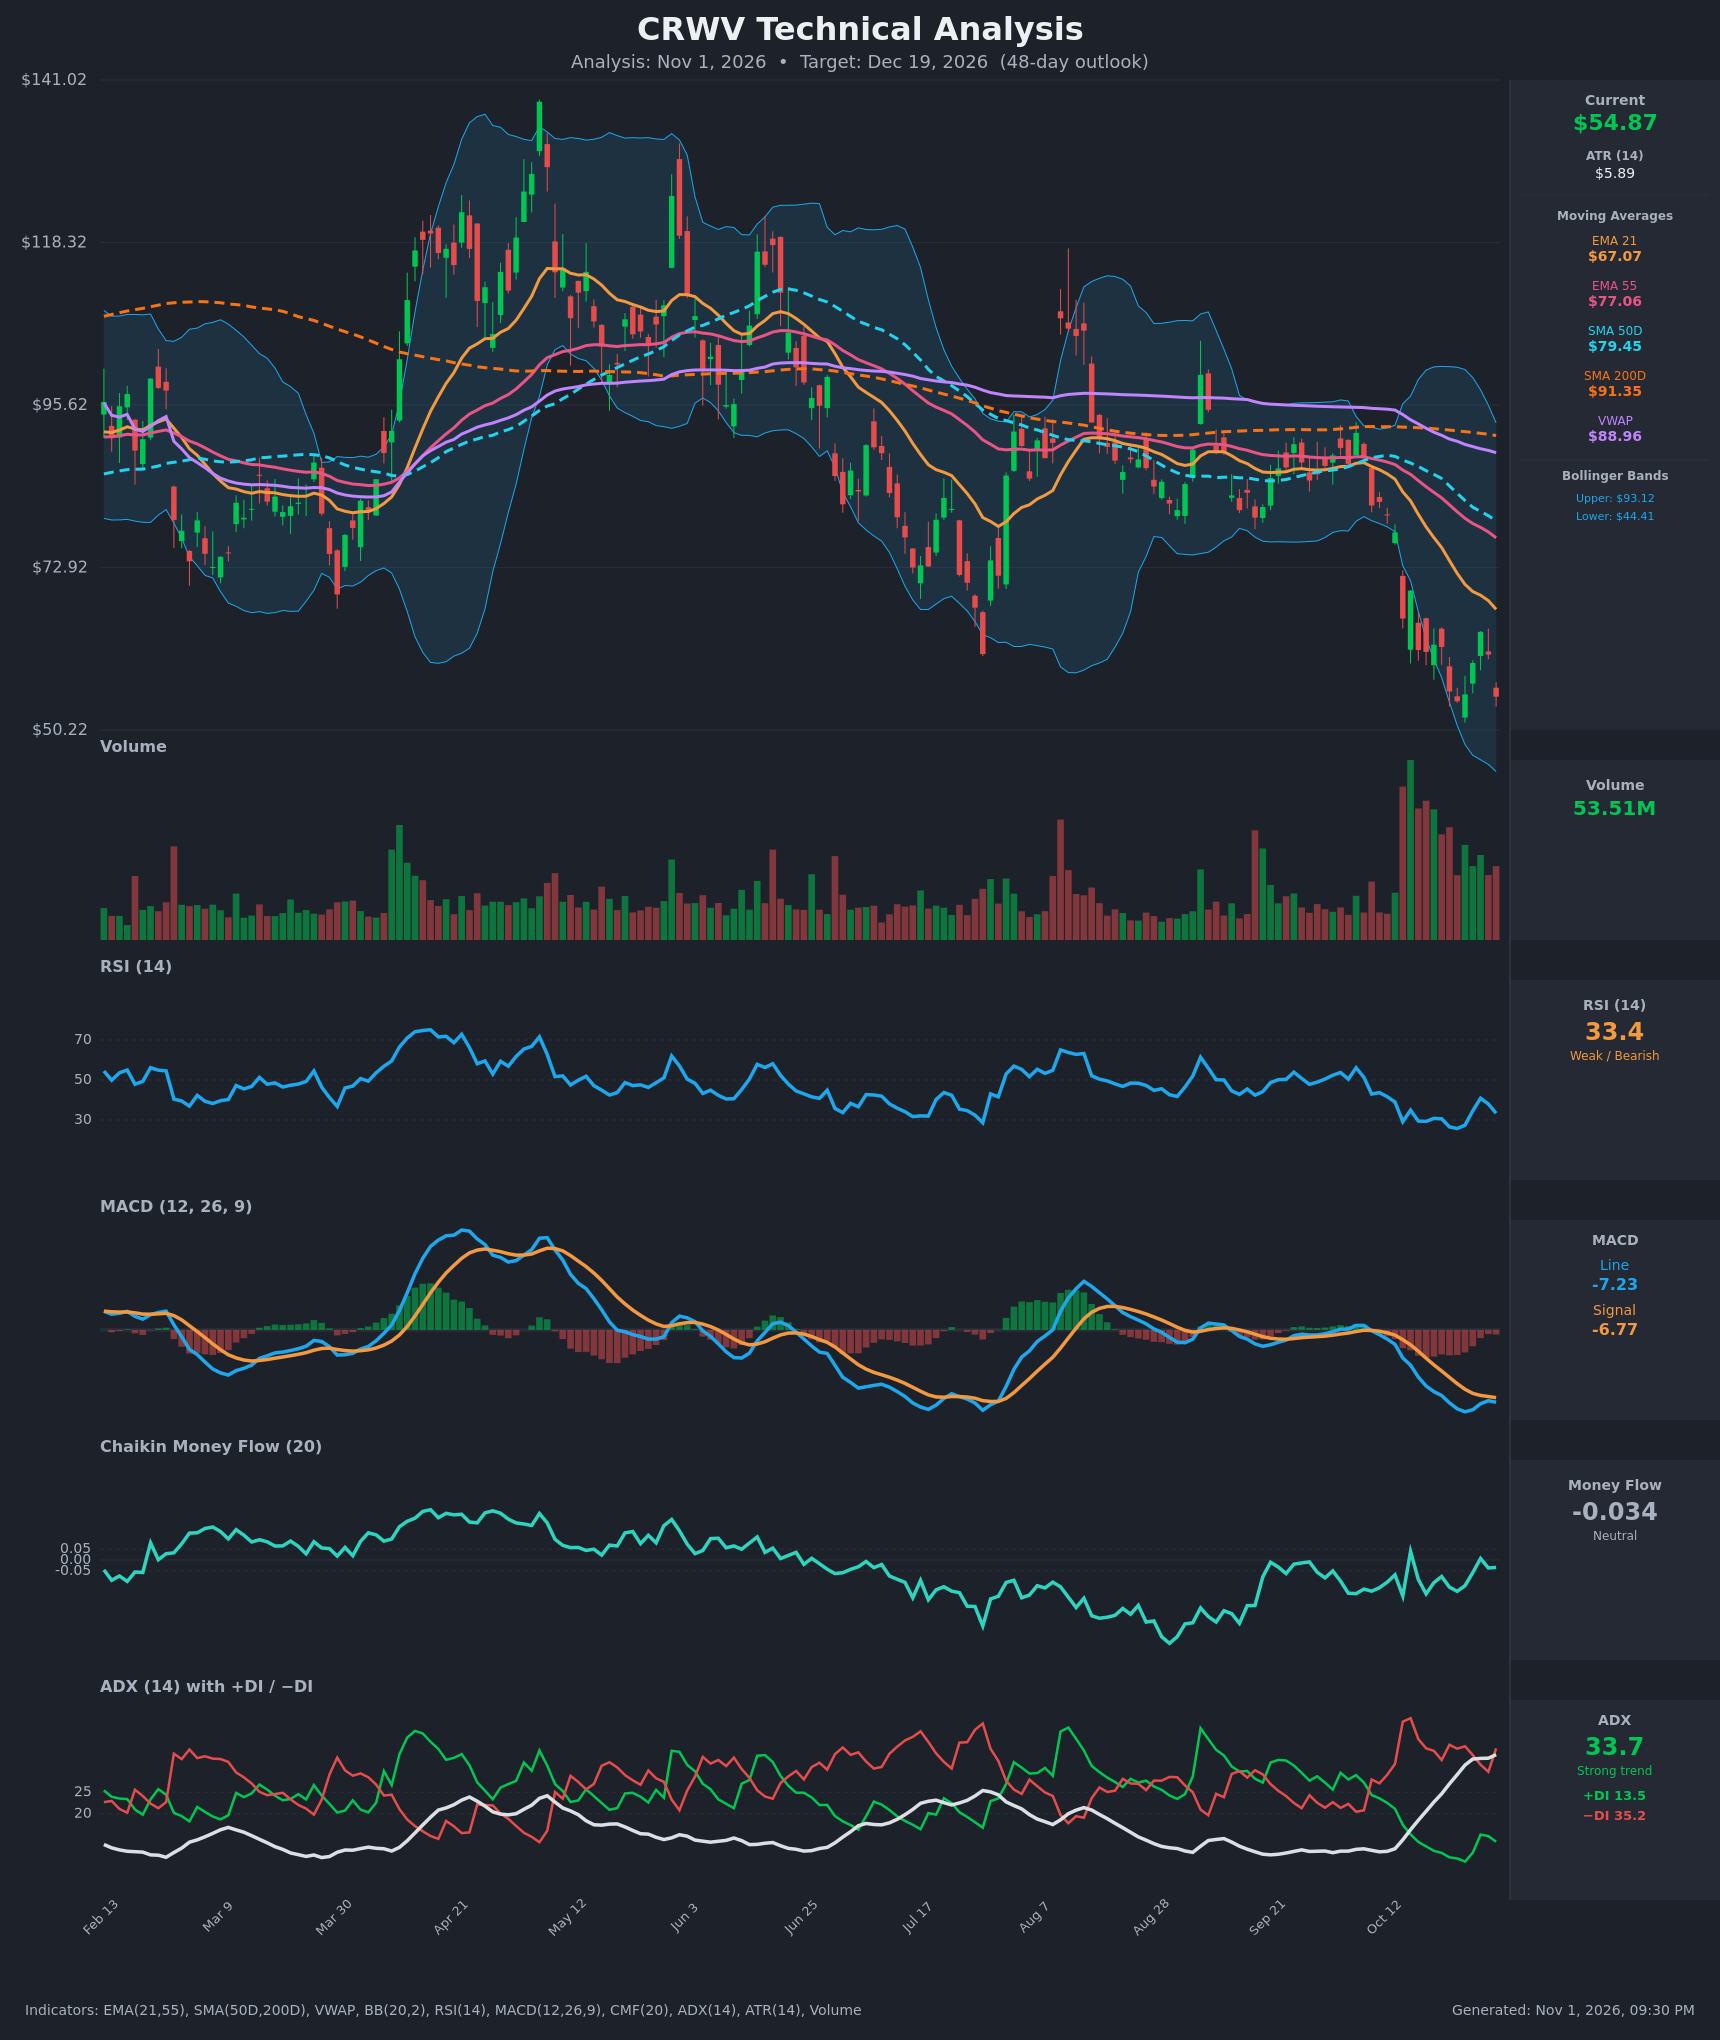
- RSI (14): 33.36, just above oversold. It bottomed at 25.8 on Oct 23, bounced to 40.9 on Oct 28, and has rolled over again. Momentum is weak, but the reading is higher than the Oct 23 reading at a nearly identical price. [Bearish]
- 20 EMA: The supplied EMA 21 is $67.07 and price at $54.87 is about 18% below it. EMA 21 is also well below EMA 55 ($77.06), so the short-term trend is down and the EMA is overhead resistance. [Bearish]
- MACD: Line -7.23 is below signal -6.77, with a histogram of about -0.46. The histogram had narrowed from about -2.2 on Oct 26 to -0.42 on Oct 29, but the line turned back down without crossing up. That is a failed bullish crossover attempt. [Bearish]
- Bollinger Bands (20): Upper $93.12, lower $44.41, a very wide band after the selloff. Price sits in the lower third, about $10 above the lower band. It is not yet at the band, and the bands are still expanding downward, which fits trend-walking rather than exhaustion. [Bearish]
- CMF (20): -0.034, inside the neutral zone. It has improved from -0.15 or lower in mid-October and briefly turned positive (+0.039, +0.007). Selling pressure is easing, but buyers are not taking control. [Neutral]
- ADX (14): 33.7 and rising sharply from about 11 on Oct 12, so a strong trend is established. −DI (35.2) is far above +DI (13.5). Bears are firmly in control. [Strong Trend – Bearish]
- Volume: 53.51M, well above the historical baseline. The late-October bars are heavy and mostly red on the breakdown. This confirms real distribution, though it could also mark a partial capitulation. [Bearish – confirms breakdown]
DIVERGENCES & TRENDS
- Mild bullish RSI divergence: Price at $54.87 is roughly equal to the Oct 23 low of $54.23, yet RSI is 33.4 versus 25.8. CMF also improved (-0.034 versus -0.143). This suggests selling momentum is fading, but it is not confirmed by MACD or ADX.
- Moving averages: SMA50D ($79.45) is below SMA200D ($91.35), a death cross that has persisted through the whole table. Price is below the SMA200D, EMA21, EMA55, SMA50D and VWAP ($88.96), so every trend reference is overhead.
- EMA/SMA spacing: EMA21 < EMA55 < SMA50D < SMA200D, a fully bearish stack. The gaps are widening, meaning the downtrend is accelerating.
- DI trend: −DI has stayed above +DI since Oct 12, and +DI has dropped from 22.5 to 13.5. The ADX climb from under 12 to 33.7 shows the trend is gaining strength.
- Relief bounce failed: The rally from $54.23 to $63.93 (Oct 28) stalled well below EMA21 and reversed. This is a lower-high sequence on the daily chart.
CHART PATTERNS
- Breakdown from the Aug–Oct range: Price consolidated in roughly $80–$95 and then broke down sharply on heavy volume. This resembles a Descending Triangle / range breakdown. The measured move points to the low-$50s and below.
- Bearish Flag / Pennant: The Oct 23 low to Oct 28 bounce, followed by the rollover, forms a small bearish flag within the downtrend. A break below the roughly $54 flag low targets about $48–$50 (the $63.93 high minus the $54.23 low is about $9.7, and the tighter pole gives about $5–$6 beyond the break).
- Possible Double Bottom attempt (low confidence): The $54.23 low and the current ~$54.87 retest could form a Bullish Double Bottom. It needs a close above the Oct 28 high of about $63.93 to confirm, and currently looks more like a retest than a base.
- Target zone: The lower Bollinger Band at $44.41 is the next major magnet if $54 fails.
POTENTIAL SCENARIOS
- Scenario 1: Bearish Trend Continuation — Price breaks below the Oct 23 low (~$54.2) and trends lower with −DI dominant, ADX staying above 30, and the MACD line staying below its signal line. Trend-walking toward the lower band is likely, with occasional bounces rejected at EMA21. Trigger: daily close below $54.00 on elevated volume. Target: $46–$50, with an extension toward $44.41. Invalidation: daily close above $64 (the Oct 28 high). (55% probability)
- Scenario 2: Bullish Oversold Relief Rally — The RSI and CMF divergence plays out and heavy volume proves a capitulation. Price squeezes back toward the EMA21 and the prior breakdown area. Trigger: close above $60.74 and a MACD bullish crossover. Target: $64–$67 (EMA21). Invalidation: close below $52. (30% probability)
- Scenario 3: Neutral Basing Range — Price chops between about $50 and $62 as selling exhausts and ADX fades from its peak. Trigger: several closes holding $52–$58 with RSI between 30 and 45. Target: $52–$58. Invalidation: close outside $50–$64. (15% probability)
PRICE TARGETS
- Target Price: $51.00 (48-day horizon, Dec 19, 2026)
- Expected Range: $46.50 to $56.00 (width $9.50, about 17.3% of current price, consistent with the 30–60 day guidance of 12–18%)
- Key Levels: Support at $50.00 (psychological level, with $44.41 lower Bollinger Band as the next support), Resistance at $63.93 (Oct 28 swing high, with EMA21 at $67.07 above)
OVERALL BIAS
OVERALL BIAS: BEARISH - Price is below every moving average with a death cross in place, ADX at 33.7 with −DI (35.2) far above +DI (13.5), and MACD below its signal line. The mild RSI/CMF divergence and heavy volume leave room for a relief bounce, but the evidence favors a drift lower toward the low-$50s or high-$40s.
This is educational analysis and not financial advice.