GOOGL 48-day bullish forecast — Nov 1, 2026
- Bias: Bullish
- Timeframe: 48 days (made Nov 1, 2026, target date Dec 18, 2026)
- Price at analysis: $279.84
- Price target: $291.00
- Expected range: $262.00 – $310.00
- Result: Pending — graded after the close on Dec 18, 2026
Get a free AI analysis of GOOGL today
Analysis
TECHNICAL INDICATORS
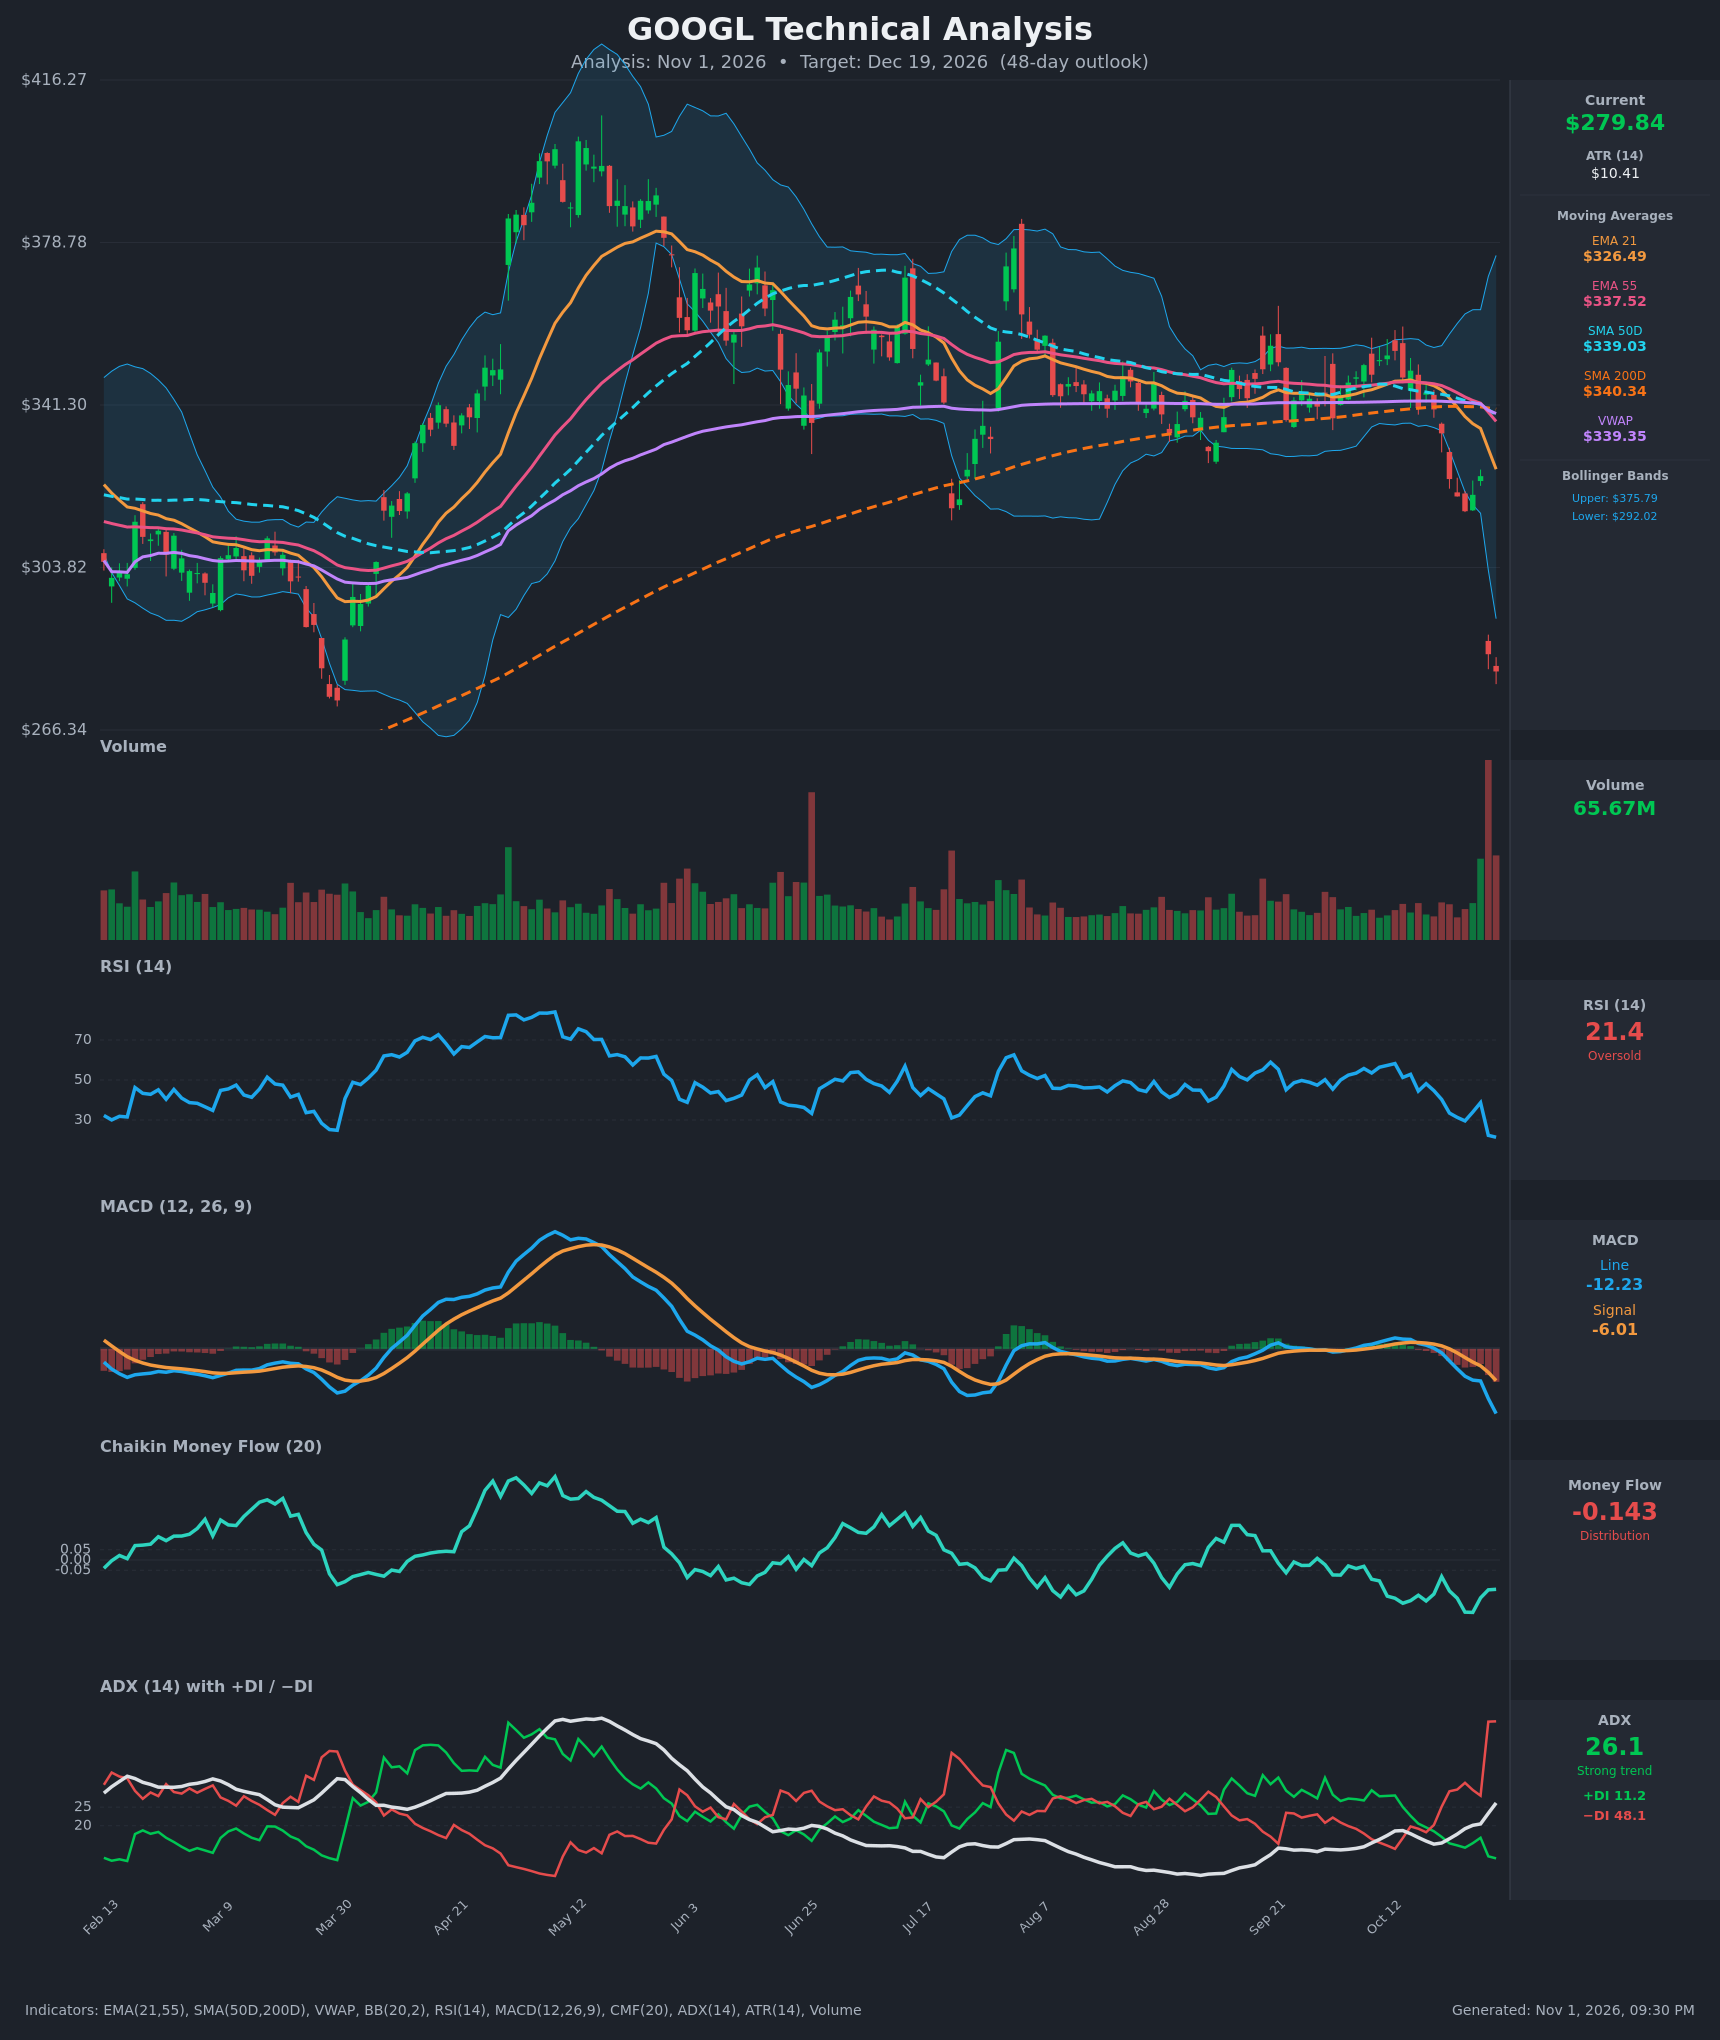
- RSI (14): 21.38, deeply oversold. It collapsed from 57 (Oct 12) to 21 in about two weeks, so momentum is still pointing down. The reading is stretched enough to favor at least a relief bounce, but there is no bullish turn yet. [Bearish]
- 20 EMA (EMA 21 = $326.49): Price at $279.84 is about 14% below it. The EMA is falling steeply and now acts as distant overhead resistance. EMA 21 has also crossed below EMA 55 ($337.52), a bearish crossover in the table. [Bearish]
- MACD: Line -12.23 is below signal -6.01 and the gap is widening. The bearish crossover occurred around Oct 22, and the histogram is increasingly negative. Momentum is accelerating down, not yet flattening. [Bearish]
- Bollinger Bands (20): Price is below the lower band ($292.02), about $12 outside it. The bands are expanding sharply (upper $375.79) after the gap volatility shock. A close this far outside the band signals an extreme move that tends to mean-revert, but in a strong trend price can "walk the band." [Neutral]
- CMF (20): -0.143, well below -0.05. It has been negative since September and is making lower lows. This shows persistent distribution and selling pressure. [Distribution]
- ADX (14): 26.1 and rising from about 15. −DI is 48.1 versus +DI 11.2, so bears dominate overwhelmingly. A new strong downtrend has just been established. [Strong Trend – Bearish]
- Volume: 65.67M, the largest bar on the chart by a wide margin, and a second heavy red bar followed it. This is heavy selling on the gap-down, a high-conviction breakdown. It could also be a capitulation or climax-type bar. [Bearish with possible exhaustion]
Moving-average context:
- Price is far below SMA50D ($339.03), SMA200D ($340.34) and VWAP ($339.35), a clear long-term break below the 200-day.
- SMA50D is about to cross below SMA200D (a death cross is forming: $339.03 vs $340.34).
- The EMA 21 / EMA 55 / SMA / VWAP cluster at $337–340 is now heavy overhead supply.
DIVERGENCES & TRENDS
- There is no bullish RSI or MACD divergence. Both made new lows with price, so momentum confirms the decline.
- RSI at 21 is the lowest on the chart (the March low was about 25). That suggests short-term exhaustion but not a reversal signal.
- The Oct 29 gap-down candle (-12.6%) took price through the lower Bollinger Band, the 200-day SMA and the entire Sep–Oct consolidation (about $335–355).
- MACD has a bearish crossover, with the line and histogram still falling.
- ADX turned up above 25 with −DI spiking. This is a trend-initiation signal on the bearish side.
- Price has stayed below every MA since Oct 21.
- The gap sits between about $284 and $325. Gaps like this usually act as resistance, and partial fills are common but slow.
CHART PATTERNS
- Symmetrical Triangle / Bearish Pennant-style consolidation, broken to the downside: From Aug to Oct, price compressed in a narrowing range around $335–355, with the MAs converging at about $340. The breakdown was a large gap through the lower boundary. This matches the "Symmetrical Triangle" bearish branch in the reference diagram.
- Measured move: The prior range height of about $30–40 projected from the breakdown near $325 points to roughly $285–295. Price has already reached that area in one gap, so the pattern target is largely achieved. That raises the odds of a pause or a bounce.
- Key resistance from the gap: $304–$325, where the March breakdown zone and the gap origin sit.
- Support: The low from earlier in the year is near $270–275 (the chart axis bottom is $266).
POTENTIAL SCENARIOS
- Scenario 1: Bullish Oversold Relief Bounce / Partial Gap Fill — RSI at 21, price well outside the lower band and a climax-volume bar favor a mean-reversion rally. Price recovers into the $292–$305 area, stalling under the falling EMA 21 and the gap. Trigger: a daily close back above $292 (lower band) with MACD histogram flattening. Target: $291–$305. Invalidation: a close below $270. (45% probability)
- Scenario 2: Bearish Trend Continuation — The post-gap drift continues with −DI dominant, MACD widening and CMF in distribution. Any bounce fails at $292–$304 and price retests and breaks the $270–275 lows. Trigger: a failed bounce under $292 or a close below $272. Target: $255–$265. Invalidation: a close above $305. (40% probability)
- Scenario 3: Neutral Base Building — Price consolidates between about $270 and $300 as selling is absorbed and indicators reset. Trigger: several sessions of narrow-range candles on declining volume. Target: $275–$290. Invalidation: a close outside the $268–$305 range. (15% probability)
PRICE TARGETS
- Target Price: $291.00 (48 days, Dec 19, 2026)
- Expected Range: $262.00 to $310.00 (width $48, about 17% of the current price, consistent with a 30–60 day horizon and ATR of $10.41)
- Key Levels: Support at $270.00, Resistance at $304.00 (the first hurdle on a bounce is the lower Bollinger Band near $292)
OVERALL BIAS
OVERALL BIAS: BULLISH - A modest bounce is favored over 48 days because RSI is at 21, price is about $12 below the lower Bollinger Band, and the gap came on climax-level volume, with the pattern's measured move already largely achieved. Conviction is low. The trend indicators (−DI 48, MACD, CMF, a forming death cross) are firmly bearish, so any rally is likely to be capped well below the $326–$340 MA cluster, and a continuation lower is nearly as probable.
This is educational analysis and not financial advice.