IBM 48-day bullish forecast — Nov 1, 2026
- Bias: Bullish
- Timeframe: 48 days (made Nov 1, 2026, target date Dec 18, 2026)
- Price at analysis: $257.81
- Price target: $267.00
- Expected range: $242.00 – $281.00
- Result: Pending — graded after the close on Dec 18, 2026
Get a free AI analysis of IBM today
Analysis
TECHNICAL INDICATORS
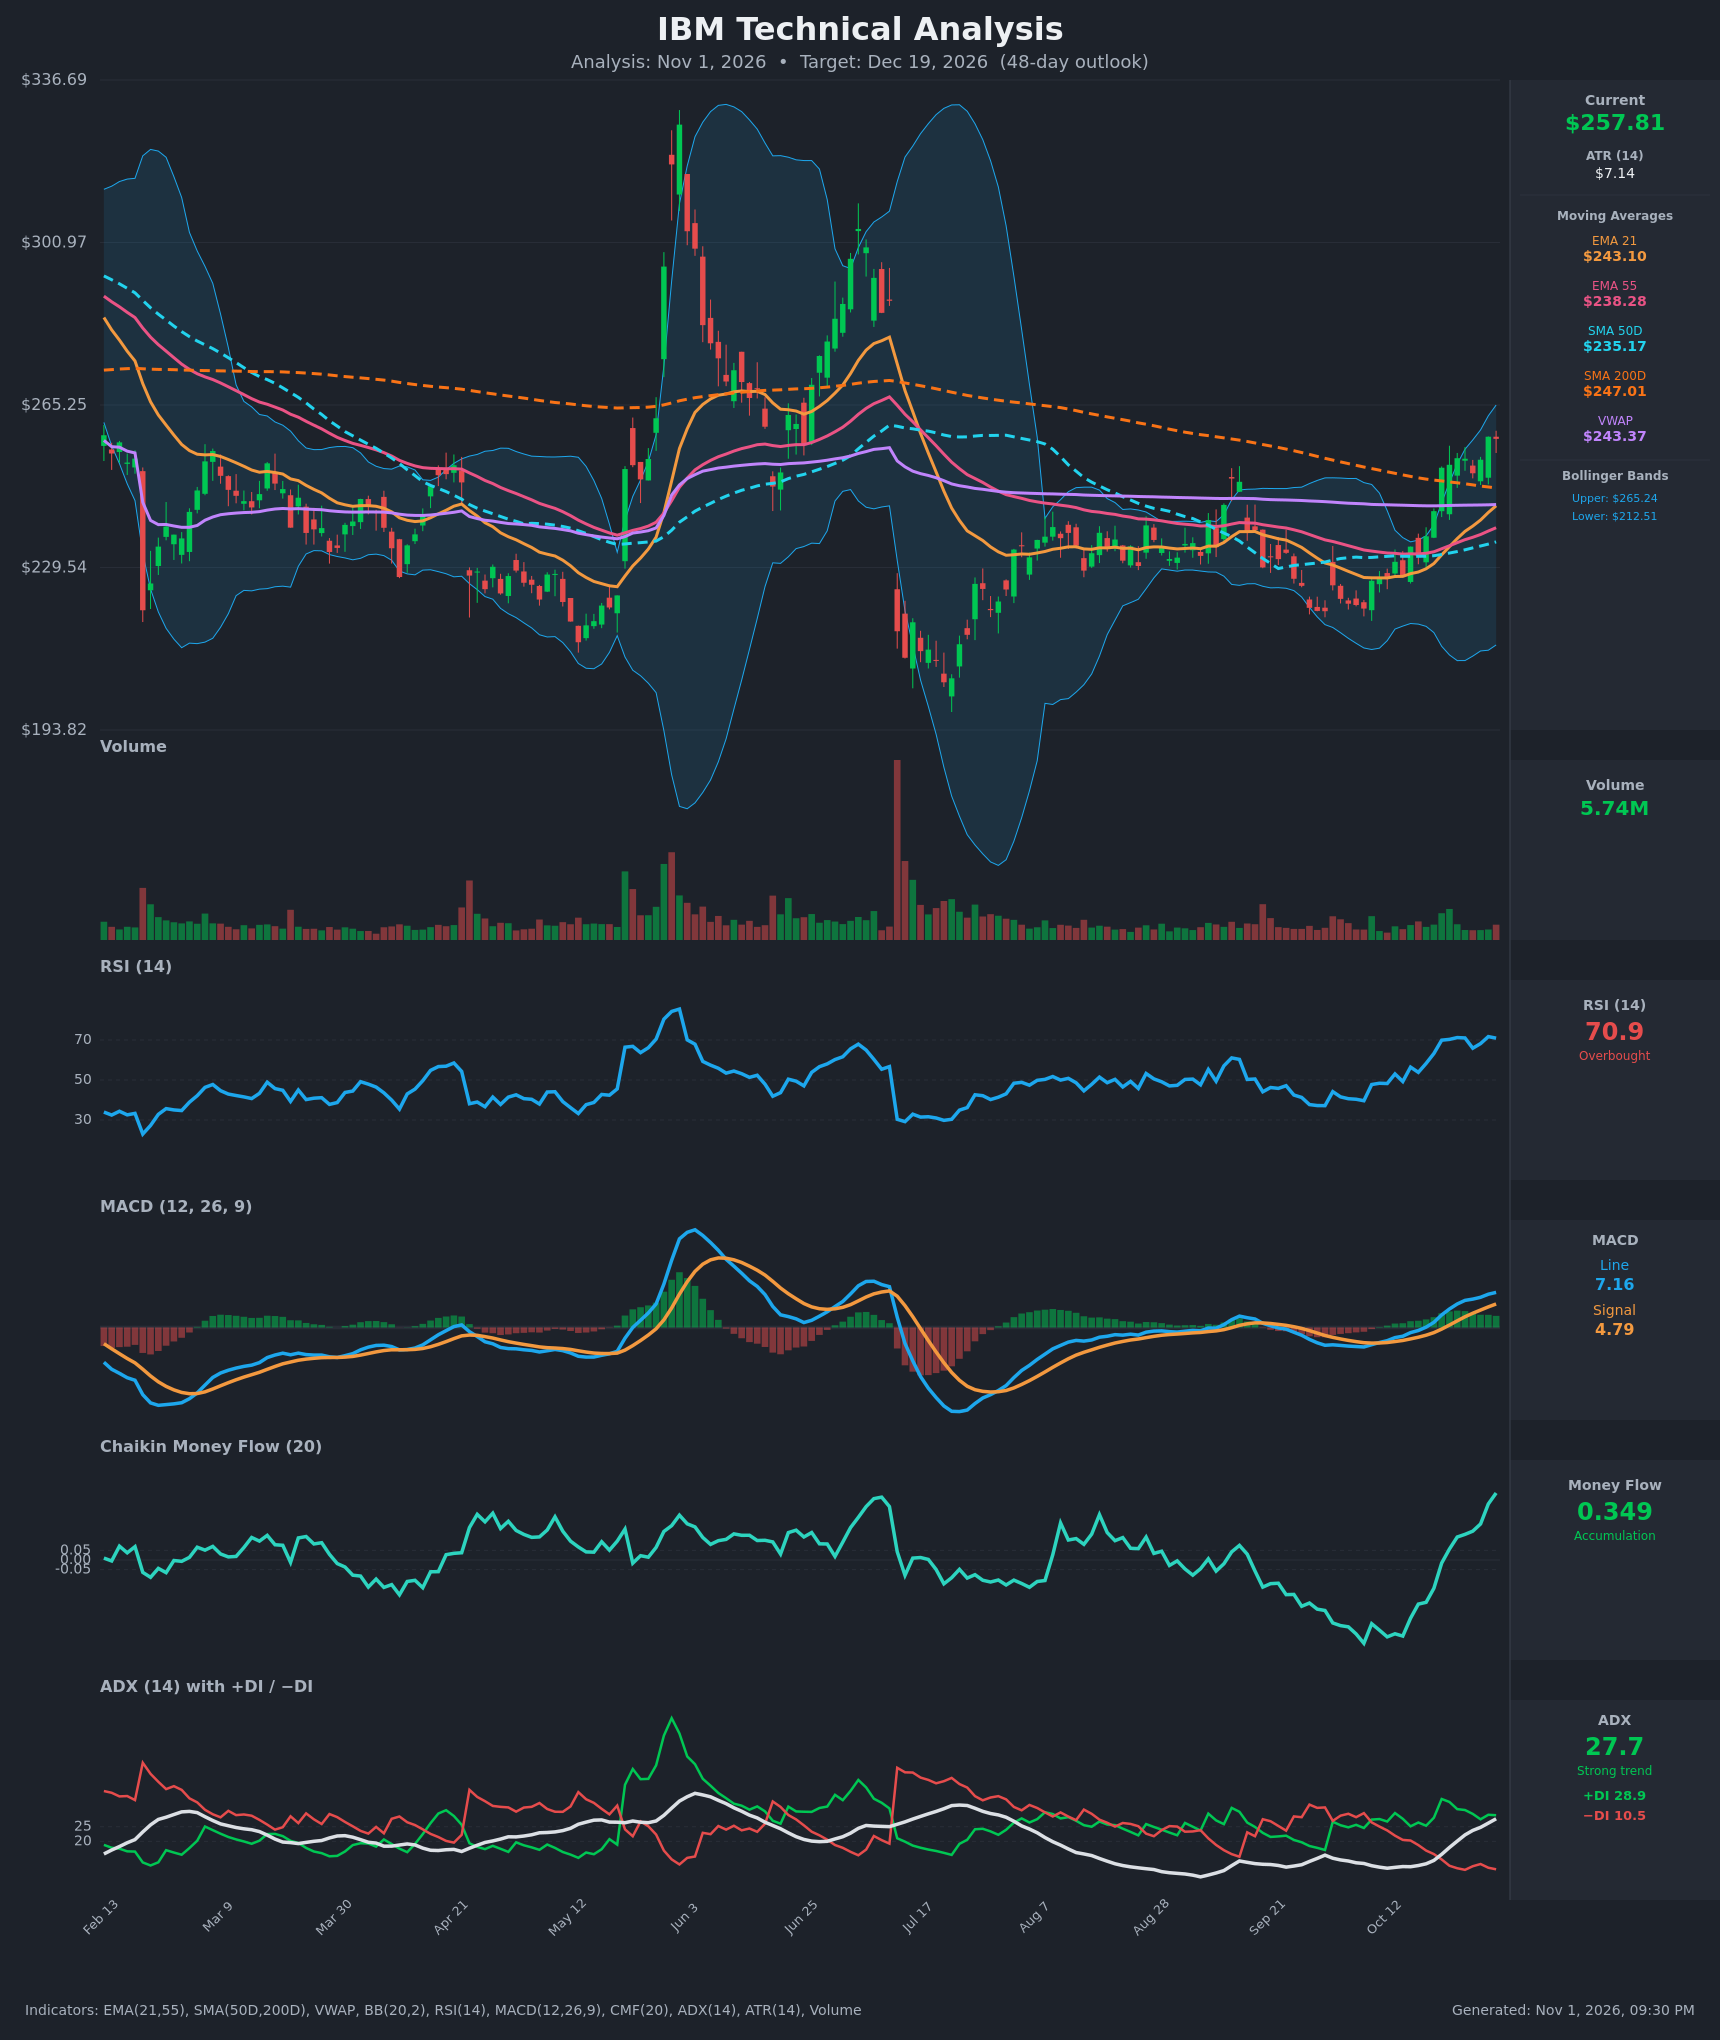
- RSI (14): 70.92, just into overbought territory. It has held at roughly 70–71 for about eight sessions after rising from 48 on Oct 12. Momentum is strong but stretched, and a pause or shallow pullback is possible. [Bullish] (with overbought caution)
- 20 EMA (EMA 21): $243.10, with price about 6% above it, so it acts as dynamic support. EMA21 crossed above EMA55 ($238.28) around Oct 23, a bullish crossover. Both are rising. [Bullish]
- MACD: Line 7.16 is above signal 4.79 and the histogram is positive and widening. The line crossed above zero on Oct 19 and has stayed above the signal throughout the 15-bar window. [Bullish]
- Bollinger Bands (20): Upper $265.24, lower $212.51, midline about $238.9. Price at $257.81 is in the upper third of the bands (%B around 0.86) and walking toward the upper band. The bands are still wide from the July volatility, so they overstate normal volatility. [Bullish] (near-term resistance at the upper band)
- CMF (20): 0.349, well above +0.05. It has swung from about -0.40 on Oct 12 to a strong positive reading, a sharp accumulation turn that confirms the breakout. [Accumulation]
- ADX (14): 27.7 and rising (from 10.8 on Oct 12), with +DI at 28.9 well above −DI at 10.5. A new, strong uptrend is forming and bulls are firmly in control. [Strong Trend + Bullish]
- Volume: 5.74M, modest compared with the spikes earlier in the year. Volume was somewhat higher on the Oct 20–21 breakout days. It is not a blow-off, but it is not a heavy-conviction surge either. [Mildly Supportive]
DIVERGENCES & TRENDS
- No clear bearish divergence: RSI is flat at about 70–71 as price makes marginally higher closes ($258.28, then $257.81). This is momentum plateauing, not a true divergence.
- Price vs SMA200D: Price reclaimed the SMA200D ($247.01) on Oct 21 and is now about 4% above it. The SMA200D is still sloping down but flattening.
- SMA50D/SMA200D: SMA50D is $235.17, below SMA200D at $247.01, so there is no golden cross yet. The gap has narrowed from about $18.6 to $11.8, and a golden cross is plausible if the rally holds.
- VWAP: Price is about 6% above VWAP ($243.37), which indicates buyer control.
- MACD vs price: The MACD line and histogram are rising with price, which confirms the move.
- ADX/DI trend: +DI has been above −DI throughout, and the gap is widening. ADX has crossed above 25 and is rising, so trend strength is increasing.
- Breakout structure: Price broke out of the Aug–Oct base (about $222–$240) with a gap-like surge on Oct 20–21 and has since held above the breakout zone.
CHART PATTERNS
- Bullish range breakout (similar to the Bullish Triple Top/rectangle breakout in the reference): The Aug–Oct sideways base of about $222–$240 broke to the upside. The measured move (roughly $18–20 of range height added to $240) gives about $258–$260, which has essentially been achieved. Further upside therefore relies on trend continuation rather than the pattern alone.
- Resistance overhead: The upper Bollinger Band at about $265 and the prior distribution area in the $275–$280 zone are the next targets. Reaching them would also fill much of the gap down from the July highs.
- No reversal pattern is confirmed. There is no double top or rising wedge yet. A stall at $265–$270 followed by a loss of $247 would raise the odds of a failed breakout.
POTENTIAL SCENARIOS
- Scenario 1: Bullish Trend Continuation — Price digests the overbought RSI with a shallow dip, then pushes through the upper Bollinger Band as ADX keeps rising and CMF stays strongly positive. A possible SMA50/SMA200 golden cross adds fuel. Trigger: daily close above $265.25 on rising volume. Target: $275–$280. Invalidation: daily close below $247 (SMA200D). (50% probability)
- Scenario 2: Neutral/Mildly Bullish Pullback Then Resume — Overbought RSI and the upper band cause a retest of the EMA21/SMA200D zone before buyers return, leaving price in a choppy $245–$265 range. Trigger: rejection at $265 with RSI falling below 60. Target: $246–$255 mid-period, ending around $255–$262. Invalidation: close above $268 (scenario 1) or below $240 (scenario 3). (30% probability)
- Scenario 3: Bearish Failed Breakout — The rally proves to be a short-covering spike below a still-falling SMA200D, and price rolls back into the old base. Trigger: close below $243 (EMA21) with MACD crossing below signal. Target: $230–$235 (SMA50D/EMA55 area). Invalidation: close back above $258. (20% probability)
PRICE TARGETS
- Target Price: $267.00 (48-day, Dec 19, 2026)
- Expected Range: $242.00 to $281.00 (width $39 ≈ 15.1% of the current price, within the 12–18% guidance for 30–60 days)
- Key Levels: Support at $247.01 (SMA200D, with EMA21 at $243.10 below it), Resistance at $275.00 (near the upper Bollinger Band at $265.24)
OVERALL BIAS
OVERALL BIAS: BULLISH - Price has broken out above the SMA200D and all key moving averages, with MACD above zero and widening, ADX rising to 27.7 with +DI far above −DI, and CMF at a strong +0.349. The main risk is overbought RSI near the upper Bollinger Band, which suggests a possible pause before further gains.
This is educational analysis and not financial advice.