NFLX 48-day bearish forecast — Nov 1, 2026
- Bias: Bearish
- Timeframe: 48 days (made Nov 1, 2026, target date Dec 18, 2026)
- Price at analysis: $62.08
- Price target: $58.50
- Expected range: $53.00 – $65.50
- Result: Pending — graded after the close on Dec 18, 2026
Get a free AI analysis of NFLX today
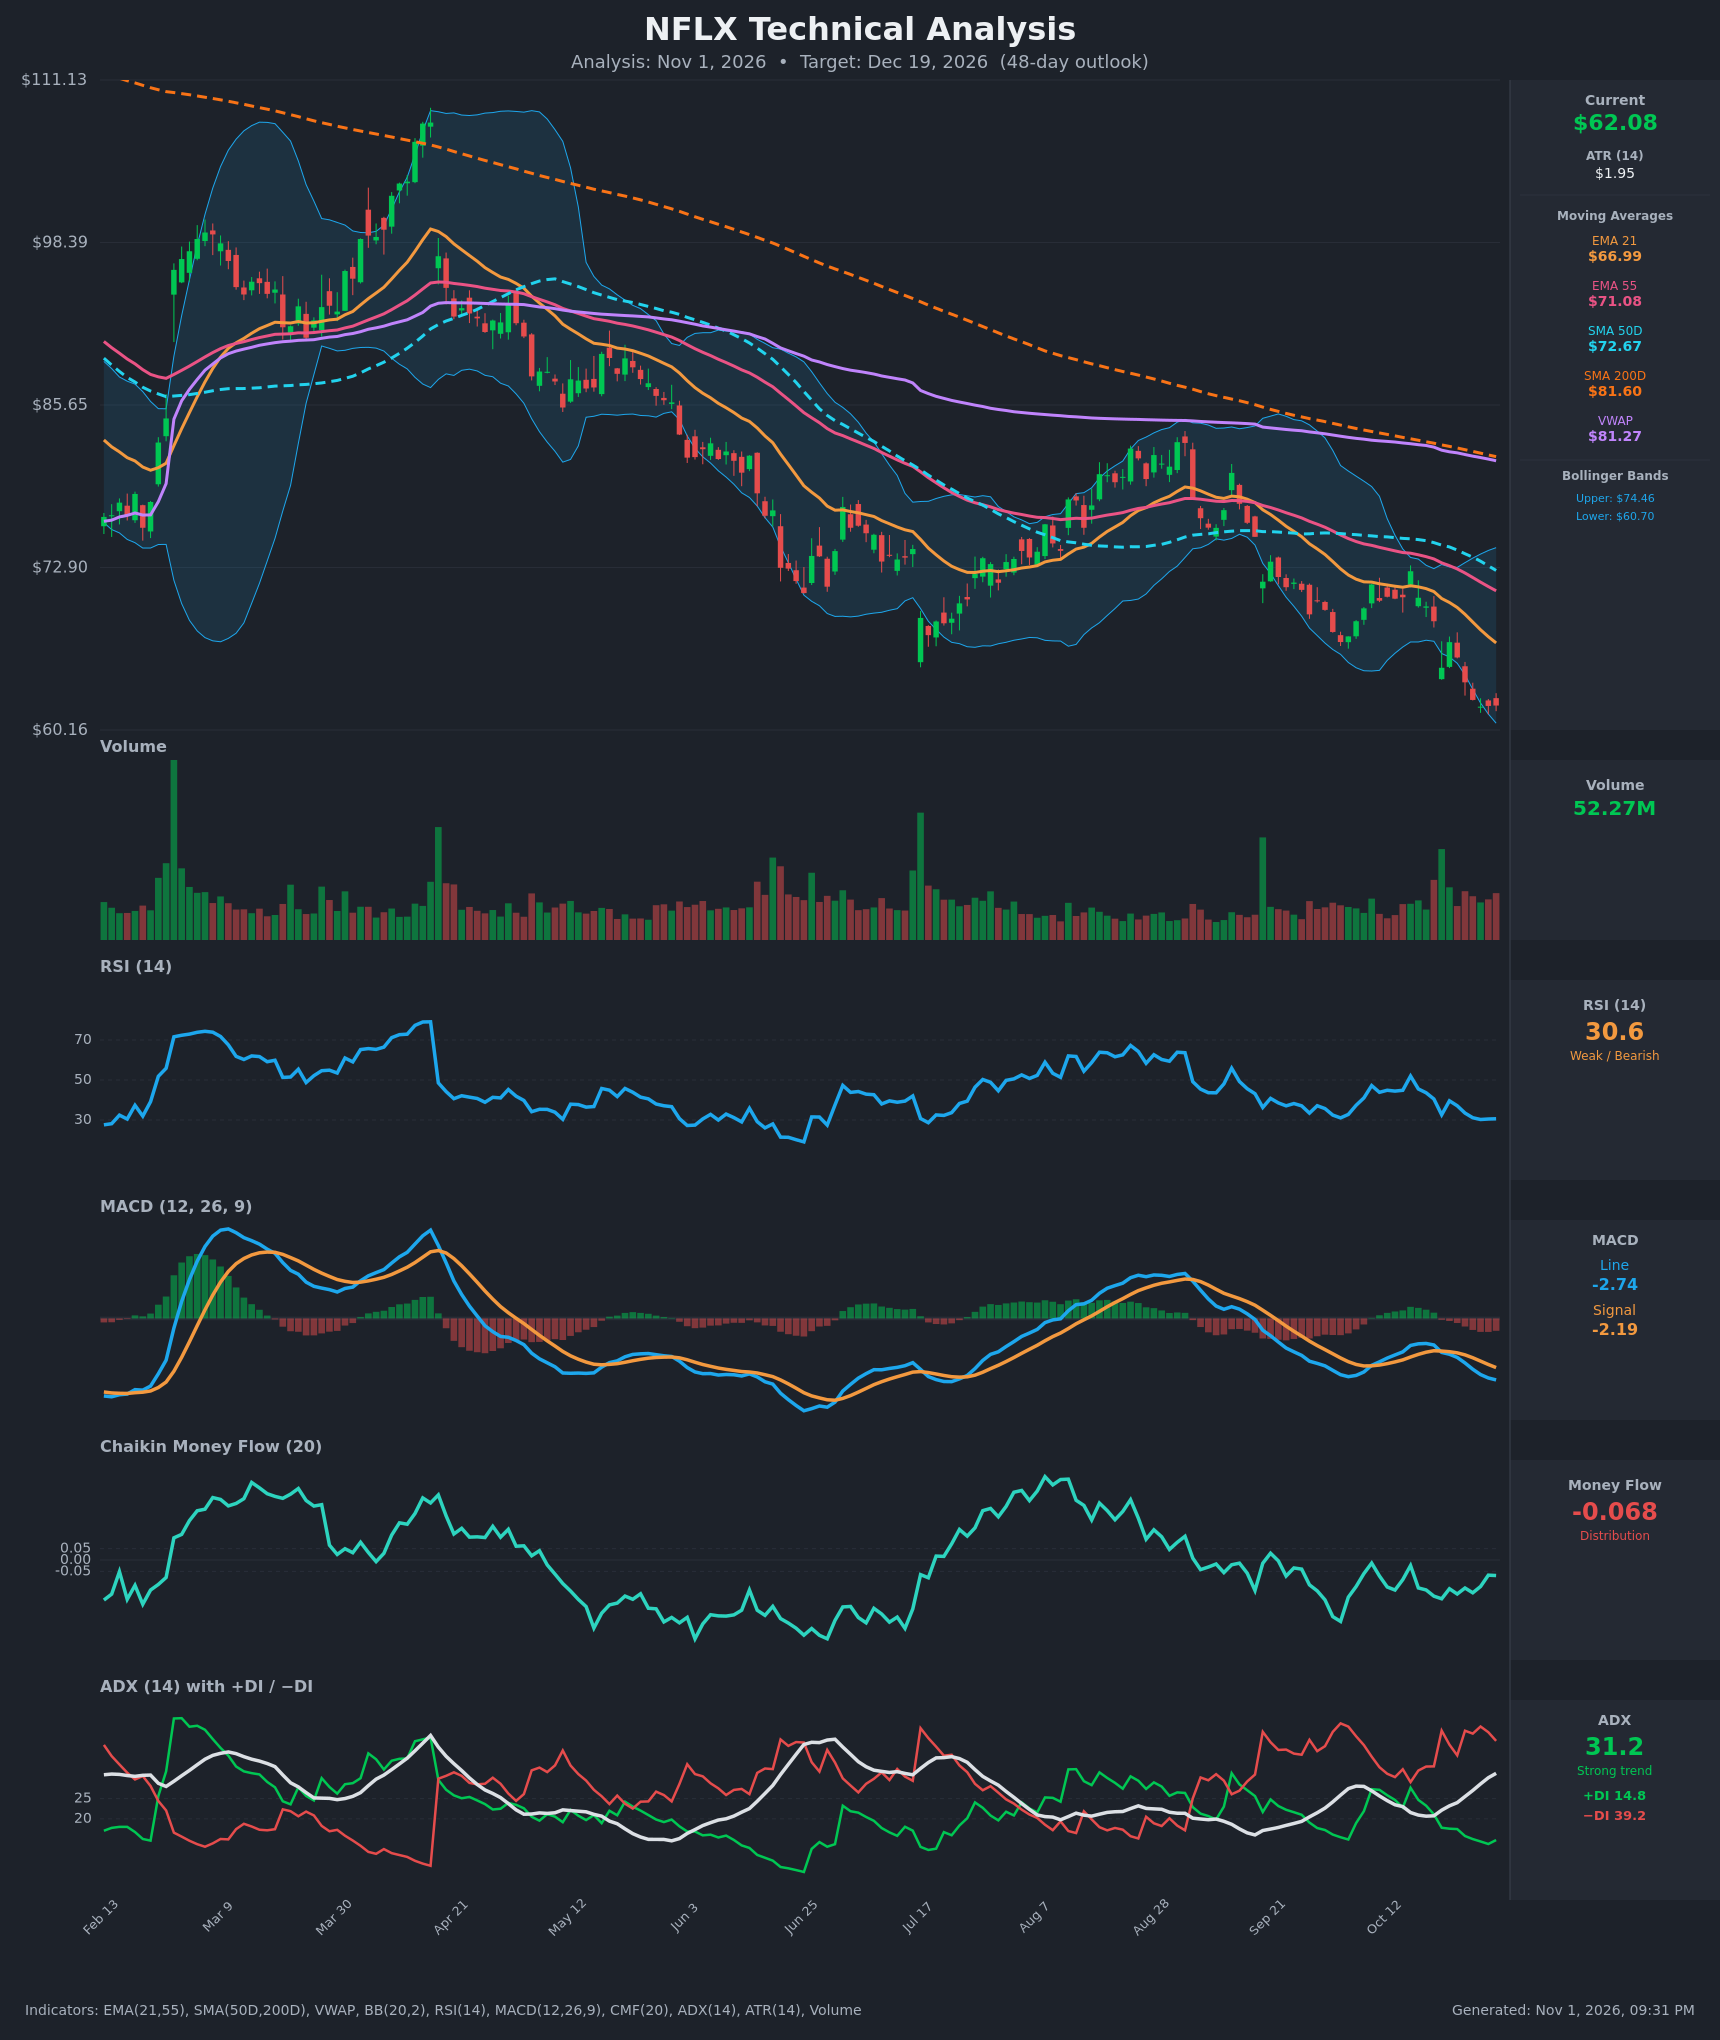
Analysis
TECHNICAL INDICATORS
- RSI (14): 30.62, hovering right at the oversold threshold for several sessions (30.3–31.1 over the last 4 bars). The reading is flat rather than turning up, so momentum is weak and not yet showing a reversal. Oversold conditions can persist in strong downtrends. [Bearish]
- 20 EMA (EMA 21): $66.99, with price at $62.08 about 7% below it. The EMA is sloping down steeply (71.5 → 67.0 in 15 bars) and acts as overhead resistance. [Bearish]
- MACD: Line -2.738 is below signal -2.189, and the gap is widening. The bearish crossover occurred around Oct 21, and the histogram is negative and expanding. Momentum is still deteriorating. [Bearish]
- Bollinger Bands (20): Upper $74.46, lower $60.70. Price at $62.08 sits in the lower band, only about $1.40 above the lower band, after repeatedly riding it lower. This is a band walk in a downtrend, with possible short-term mean-reversion if it stalls. [Bearish]
- CMF (20): -0.068, below the -0.05 threshold, though it has improved from -0.170 on Oct 21. Distribution is persistent but easing slightly. [Distribution]
- ADX (14): 31.2 and rising (20.7 → 31.2), with -DI 39.2 well above +DI 14.8. This is a strong, established downtrend with sellers firmly in control. [Strong Trend – Bearish]
- Volume: 52.27M, elevated relative to the recent average, with several high-volume bars during the latest leg down and no clear capitulation spike. Volume is not yet signaling a selling climax. [Bearish / Confirming selling]
DIVERGENCES & TRENDS
- No bullish divergence yet: RSI is making flat lows near 30 while price makes lower lows. MACD is also making new lows, so momentum confirms price.
- Moving average stack is fully bearish: Price ($62.08) < EMA21 ($66.99) < EMA55 ($71.08) < SMA50D ($72.67) < SMA200D ($81.60) < VWAP ($81.27). Every average is declining.
- Death cross is in place: SMA50D is well below SMA200D (a ~$9 gap), and the gap has persisted for months. EMA21 is below EMA55 with the spread widening.
- Trend in ADX/DI: −DI has been above +DI since Oct 14, and the ADX climb from 20 to 31 shows the trend strengthening.
- Price is at a multi-month low: The chart's lowest axis level is $60.16, so price is near the bottom of the visible range, roughly 44% below the Apr peak near $108. The next support is thin below the lower Bollinger Band at $60.70.
- Stretched but not reversed: Price is far below all averages, which raises the risk of a relief bounce. A bounce would most likely stall at the EMA21 (~$67).
CHART PATTERNS
- Primary pattern: A persistent descending channel and lower-high/lower-low structure from the April peak. This is most akin to a continuation downtrend (the Bearish Flag / Descending Triangle family) rather than a reversal formation. The Aug-Sep bounce was a lower high that failed under the 50-day SMA and the downtrend resumed.
- Breakdown: The September break below the ~$72 base led to the current leg lower, with a measured move extending toward the high $50s.
- Reversal candidates: There is no confirmed Double Bottom or Falling Wedge yet. A Bullish Falling Wedge could form if price keeps making lower lows on shrinking momentum, but the evidence does not support it now.
- Target logic: The prior consolidation range of about $72 to $66 (a ~$6 height) projected from the breakdown suggests approximately $60 to $58.
POTENTIAL SCENARIOS
- Scenario 1: Bearish Trend Continuation — Sellers remain in control (−DI 39 vs +DI 15, ADX rising, MACD widening). Price breaks the lower Bollinger Band and the $60.16 low, grinding lower with only weak bounces to the EMA21. Trigger: daily close below $60.16. Target: $55 to $57. Invalidation: close above $67 (EMA21). (50% probability)
- Scenario 2: Neutral/Bullish Oversold Relief Bounce, then Fade — RSI at 30 and price at the lower band trigger a mean-reversion rally to the EMA21/middle band that fails below the EMA55. Trigger: RSI holds above 30 and price closes above $65. Target: $65 to $68. Invalidation: close below $60. (35% probability)
- Scenario 3: Bullish Trend Reversal — Heavy-volume capitulation flushes weak holders, MACD turns up, and price reclaims the EMA55. Trigger: close above $71 with CMF above +0.05. Target: $72 to $75. Invalidation: failure at $67 and a new low. (15% probability)
PRICE TARGETS
For the 48-day horizon (to Dec 19, 2026), the range width should be ~12–18% of price, so I use about 18% ($11.20).
- Target Price: $58.50
- Expected Range: $53.00 to $65.50 (width $12.50, about 20% of current price)
- Key Levels: Support at $60.16, Resistance at $66.99
OVERALL BIAS
OVERALL BIAS: BEARISH - Every moving average is stacked above price with a death cross in place, ADX at 31 with −DI dominating, MACD widening below signal, and CMF showing distribution. The oversold RSI near 30 raises the odds of bounces, but with no divergence or reversal pattern, the path of least resistance remains lower.
This is educational analysis and not financial advice.