MSFT 48-day bearish forecast — Nov 1, 2026
- Bias: Bearish
- Timeframe: 48 days (made Nov 1, 2026, target date Dec 18, 2026)
- Price at analysis: $521.91
- Price target: $505.00
- Expected range: $468.00 – $546.00
- Result: Pending — graded after the close on Dec 18, 2026
Get a free AI analysis of MSFT today
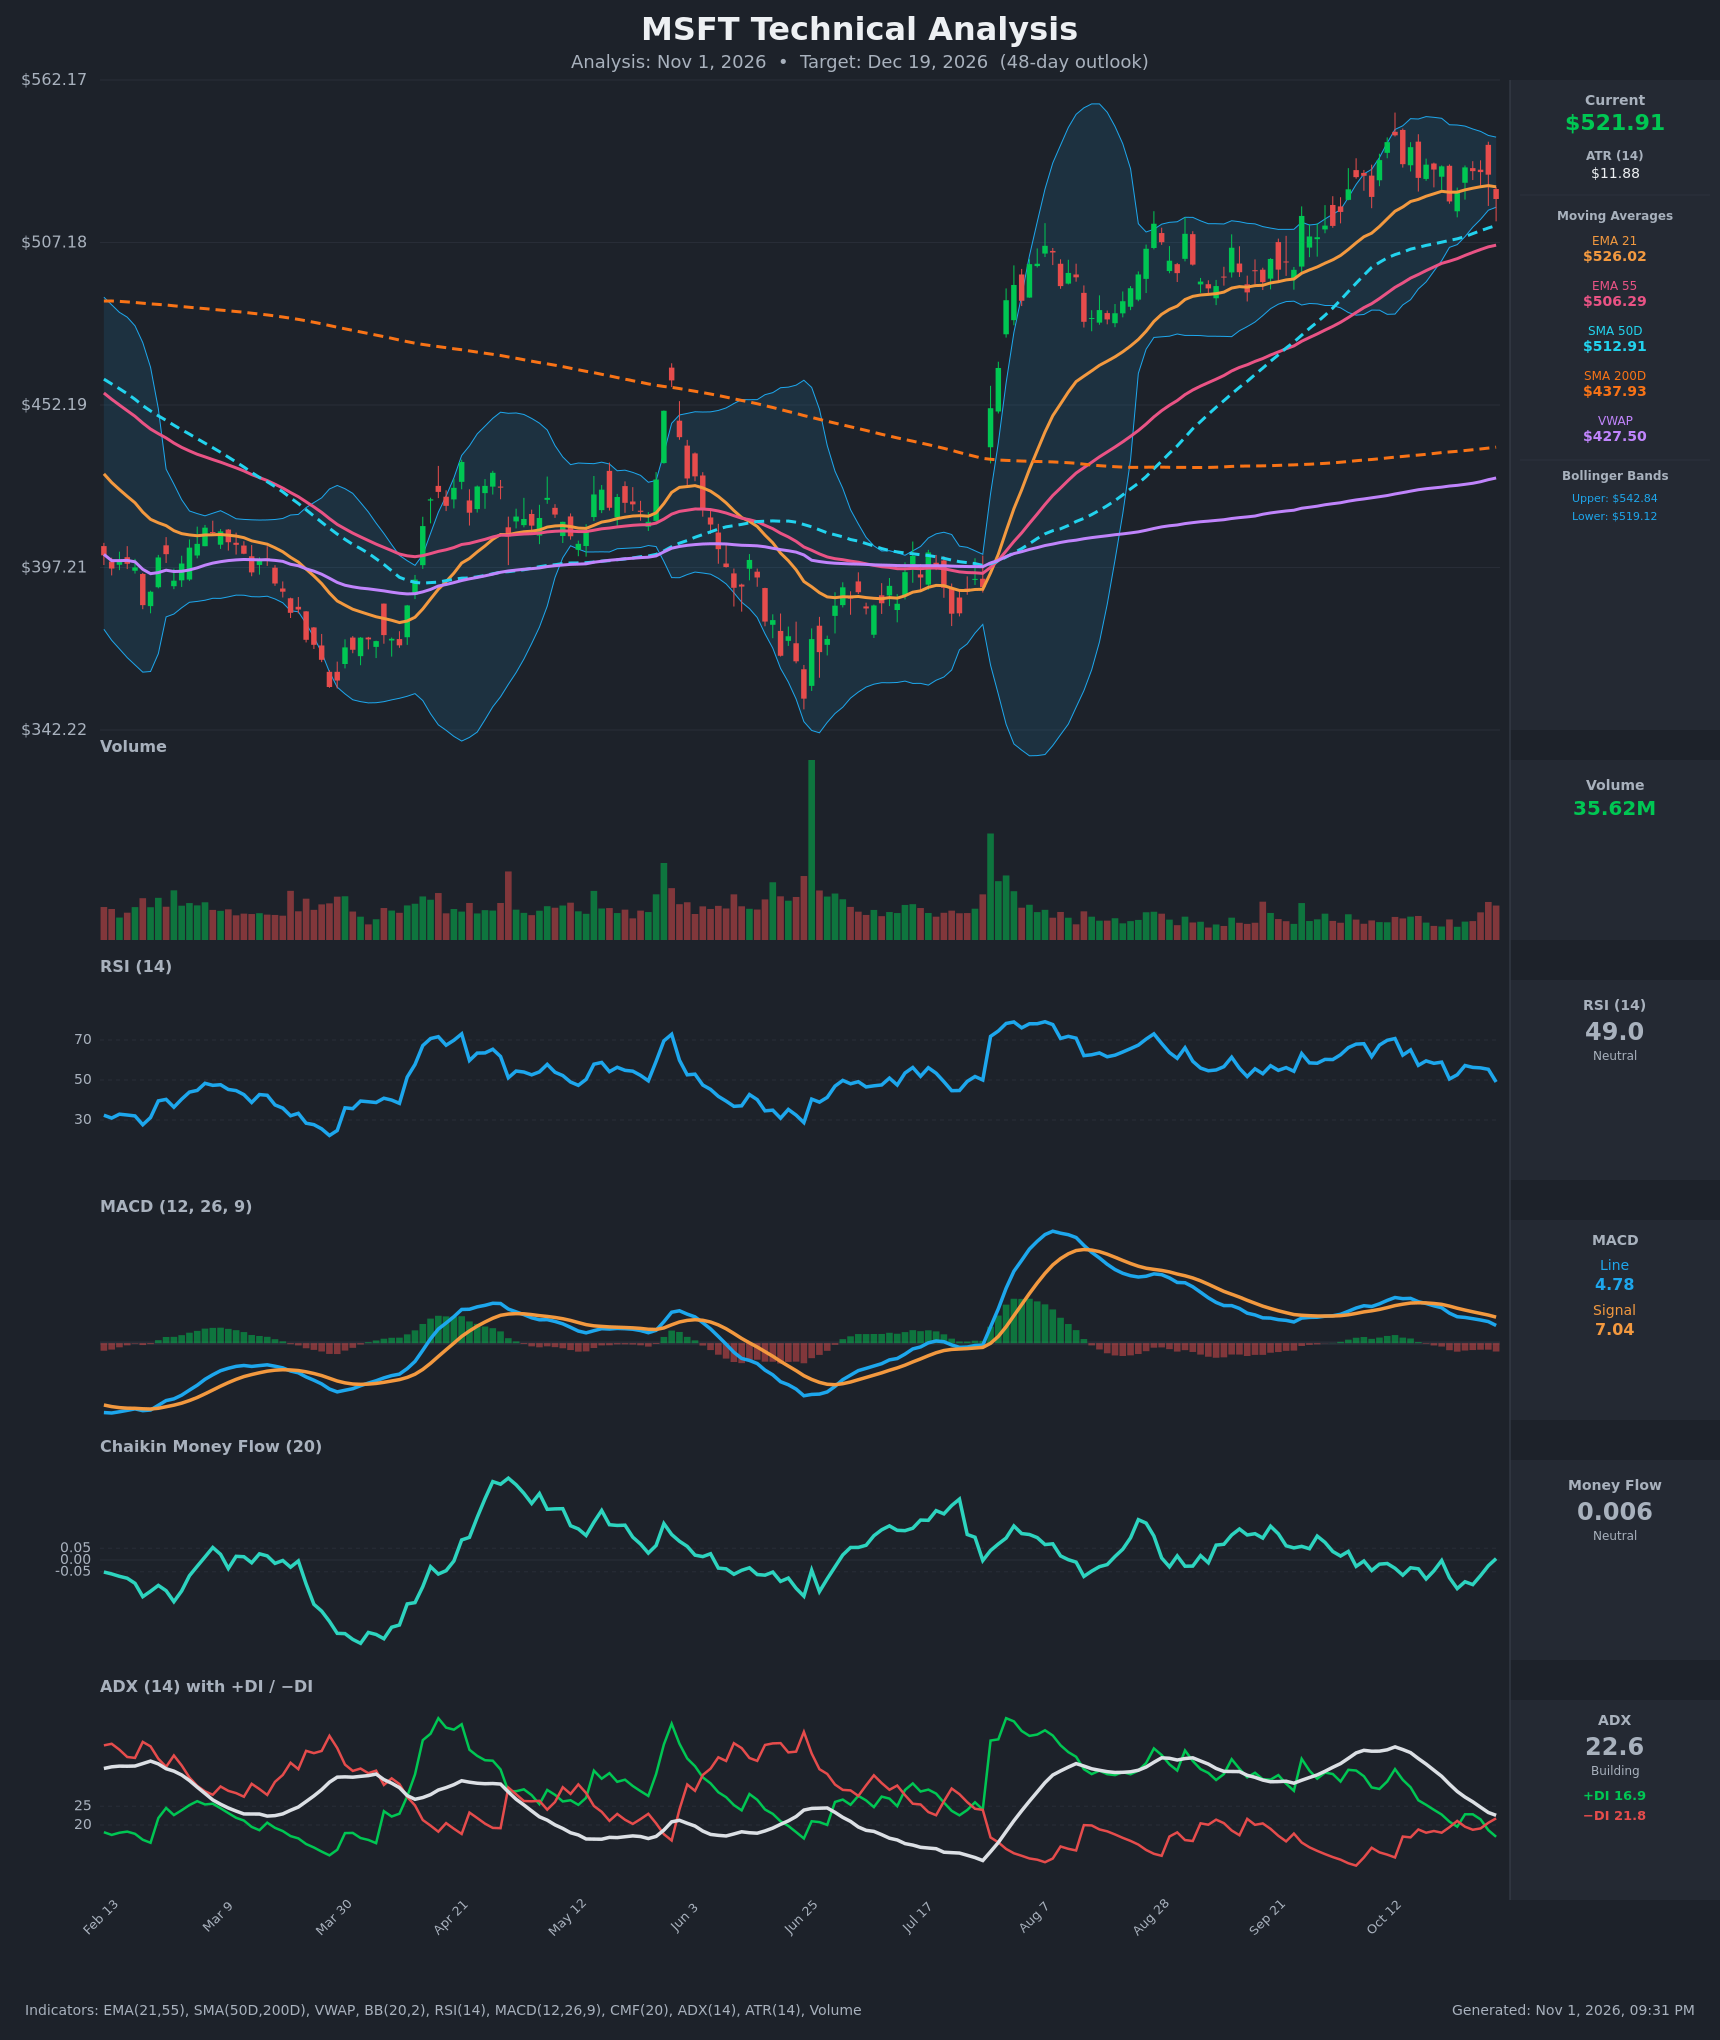
Analysis
TECHNICAL INDICATORS
- RSI (14): 49.02, down from 70.7 on Oct 13 and now at the midline. Momentum has faded steadily, and a drop under 45 would confirm a shift toward bearish momentum. [Neutral]
- 20 EMA (EMA 21): $526.02, with price at $521.91 just below it. Price closed under the EMA for the first time since mid-October, so the EMA is now near-term resistance. EMA 55 at $506.29 sits well below and still rises. [Bearish]
- MACD: Line 4.78 is below signal 7.04. A bearish cross occurred on Oct 19, and the gap and the negative histogram have widened since the cross. Both lines are far below the August peak. [Bearish]
- Bollinger Bands (20): Upper $542.84, lower $519.12. Price at $521.91 is hugging the lower band after being rejected from the upper band in mid-October. The bands are narrowing from the August expansion. A close below the lower band would signal a downside break, while a bounce would target the mid-band near $531. [Bearish]
- CMF (20): 0.006, inside the ±0.05 neutral zone. It has been negative for most of October and only just ticked back to zero, so there is no accumulation to support a rally. [Neutral]
- ADX (14): 22.6 and falling from 40.8, so the trend is weakening and nearly range-bound. −DI (21.8) is above +DI (16.9), a bearish crossover that gives sellers a slight edge. [Weak Trend, Bearish lean]
- Volume: 35.62M, around average with no capitulation spike. Recent red candles carry slightly heavier volume than green ones, and the Oct 30 drop came on average volume rather than a surge. [Mildly Bearish / Neutral]
DIVERGENCES & TRENDS
- Price vs. momentum: Price made a high near $543 on Oct 13, while MACD and RSI have made lower highs since. This is bearish divergence, and RSI fell from 70 to 49 while price stayed close to its highs.
- Moving averages: The long-term structure is bullish. The golden cross is in place (SMA50 $512.91 over SMA200 $437.93), EMA21 is above EMA55, and price is far above SMA200 and VWAP ($427.50). Price has now lost EMA21, and the first support layer is SMA50 and EMA55 at about $506–513.
- Indicator crossovers: MACD crossed below its signal on Oct 19, and −DI crossed above +DI on Oct 23 and again on Oct 30. ADX is falling, so the August trend is fading into consolidation or a pullback.
- Spread between EMAs: EMA21 is flattening while EMA55 and SMA50 keep rising, so the gap is narrowing. A test of the faster averages is likely.
CHART PATTERNS
- Bearish Double Top (tentative): Peaks at about $543 (Oct 13) and $539–541 (Oct 15, with a failed retest on Oct 26), with a neckline near $521 (Oct 22 low of $521.08). Price is sitting right on the neckline. A confirmed close below about $519 projects a measured move of roughly $22 (peak minus neckline), to about $497–500.
- Consolidation at highs: Since August the stock has made a series of higher highs and lows in a rising channel, which is a bullish continuation structure. The September–October range has narrowed toward a symmetrical triangle or flag shape. Failure of the lower boundary near $519 would turn this into a rising-wedge-style reversal. A hold would favour continuation toward $545+.
- Net read: The pattern is unconfirmed and depends on the neckline. The weight of short-term indicators favours the breakdown, with the SMA50/EMA55 zone as the likely landing area.
POTENTIAL SCENARIOS
- Scenario 1: Bearish Double-Top Pullback to the 50-day — Price loses the $519–521 neckline and lower Bollinger Band, then drifts to the SMA50/EMA55 zone and possibly the gap area below. Trigger: daily close below $519 with MACD still under signal and −DI above +DI. Target: $505, with an extension to $495–500 on the measured move. Invalidation: daily close above $533 that reclaims EMA21 and the mid-band. (45% probability)
- Scenario 2: Bullish Trend Resumption — The pullback holds above SMA50, momentum resets with RSI near 45–50, and buyers push price back to the highs of the rising channel. Trigger: bounce from $513–519 and a close above $532 with MACD re-crossing up. Target: $543–555. Invalidation: close below $506 (EMA55). (35% probability)
- Scenario 3: Neutral Range Consolidation — Weak ADX keeps price chopping between the SMA50 and EMA21/mid-band. Trigger: ADX under 20 and repeated closes between $510 and $532. Target: $515–525 at the end of the period. Invalidation: close outside $505–$543. (20% probability)
PRICE TARGETS
- Target Price: $505.00 (48-day, Dec 19, 2026)
- Expected Range: $468.00 to $546.00 (width $78, about 14.9% of current price, in line with the 30–60 day guidance of 12–18%)
- Key Levels: Support at $512.91 (SMA50), Resistance at $526.02 (EMA21). Major resistance above that is the $543.45 swing high, and deeper support is EMA55 at $506.29.
OVERALL BIAS
OVERALL BIAS: BEARISH - Price has lost the 21 EMA and is sitting on the lower Bollinger Band and the $521 double-top neckline. MACD and the DI lines are both bearish, RSI is diverging from price, and CMF shows no accumulation. The long-term uptrend (golden cross, price above SMA200) should limit the downside to the $505–513 area rather than a deeper collapse.
This is educational analysis and not financial advice.