NVDA 48-day bearish forecast — Nov 1, 2026
- Bias: Bearish
- Timeframe: 48 days (made Nov 1, 2026, target date Dec 18, 2026)
- Price at analysis: $204.64
- Price target: $196.50
- Expected range: $179.00 – $219.00
- Result: Pending — graded after the close on Dec 18, 2026
Get a free AI analysis of NVDA today
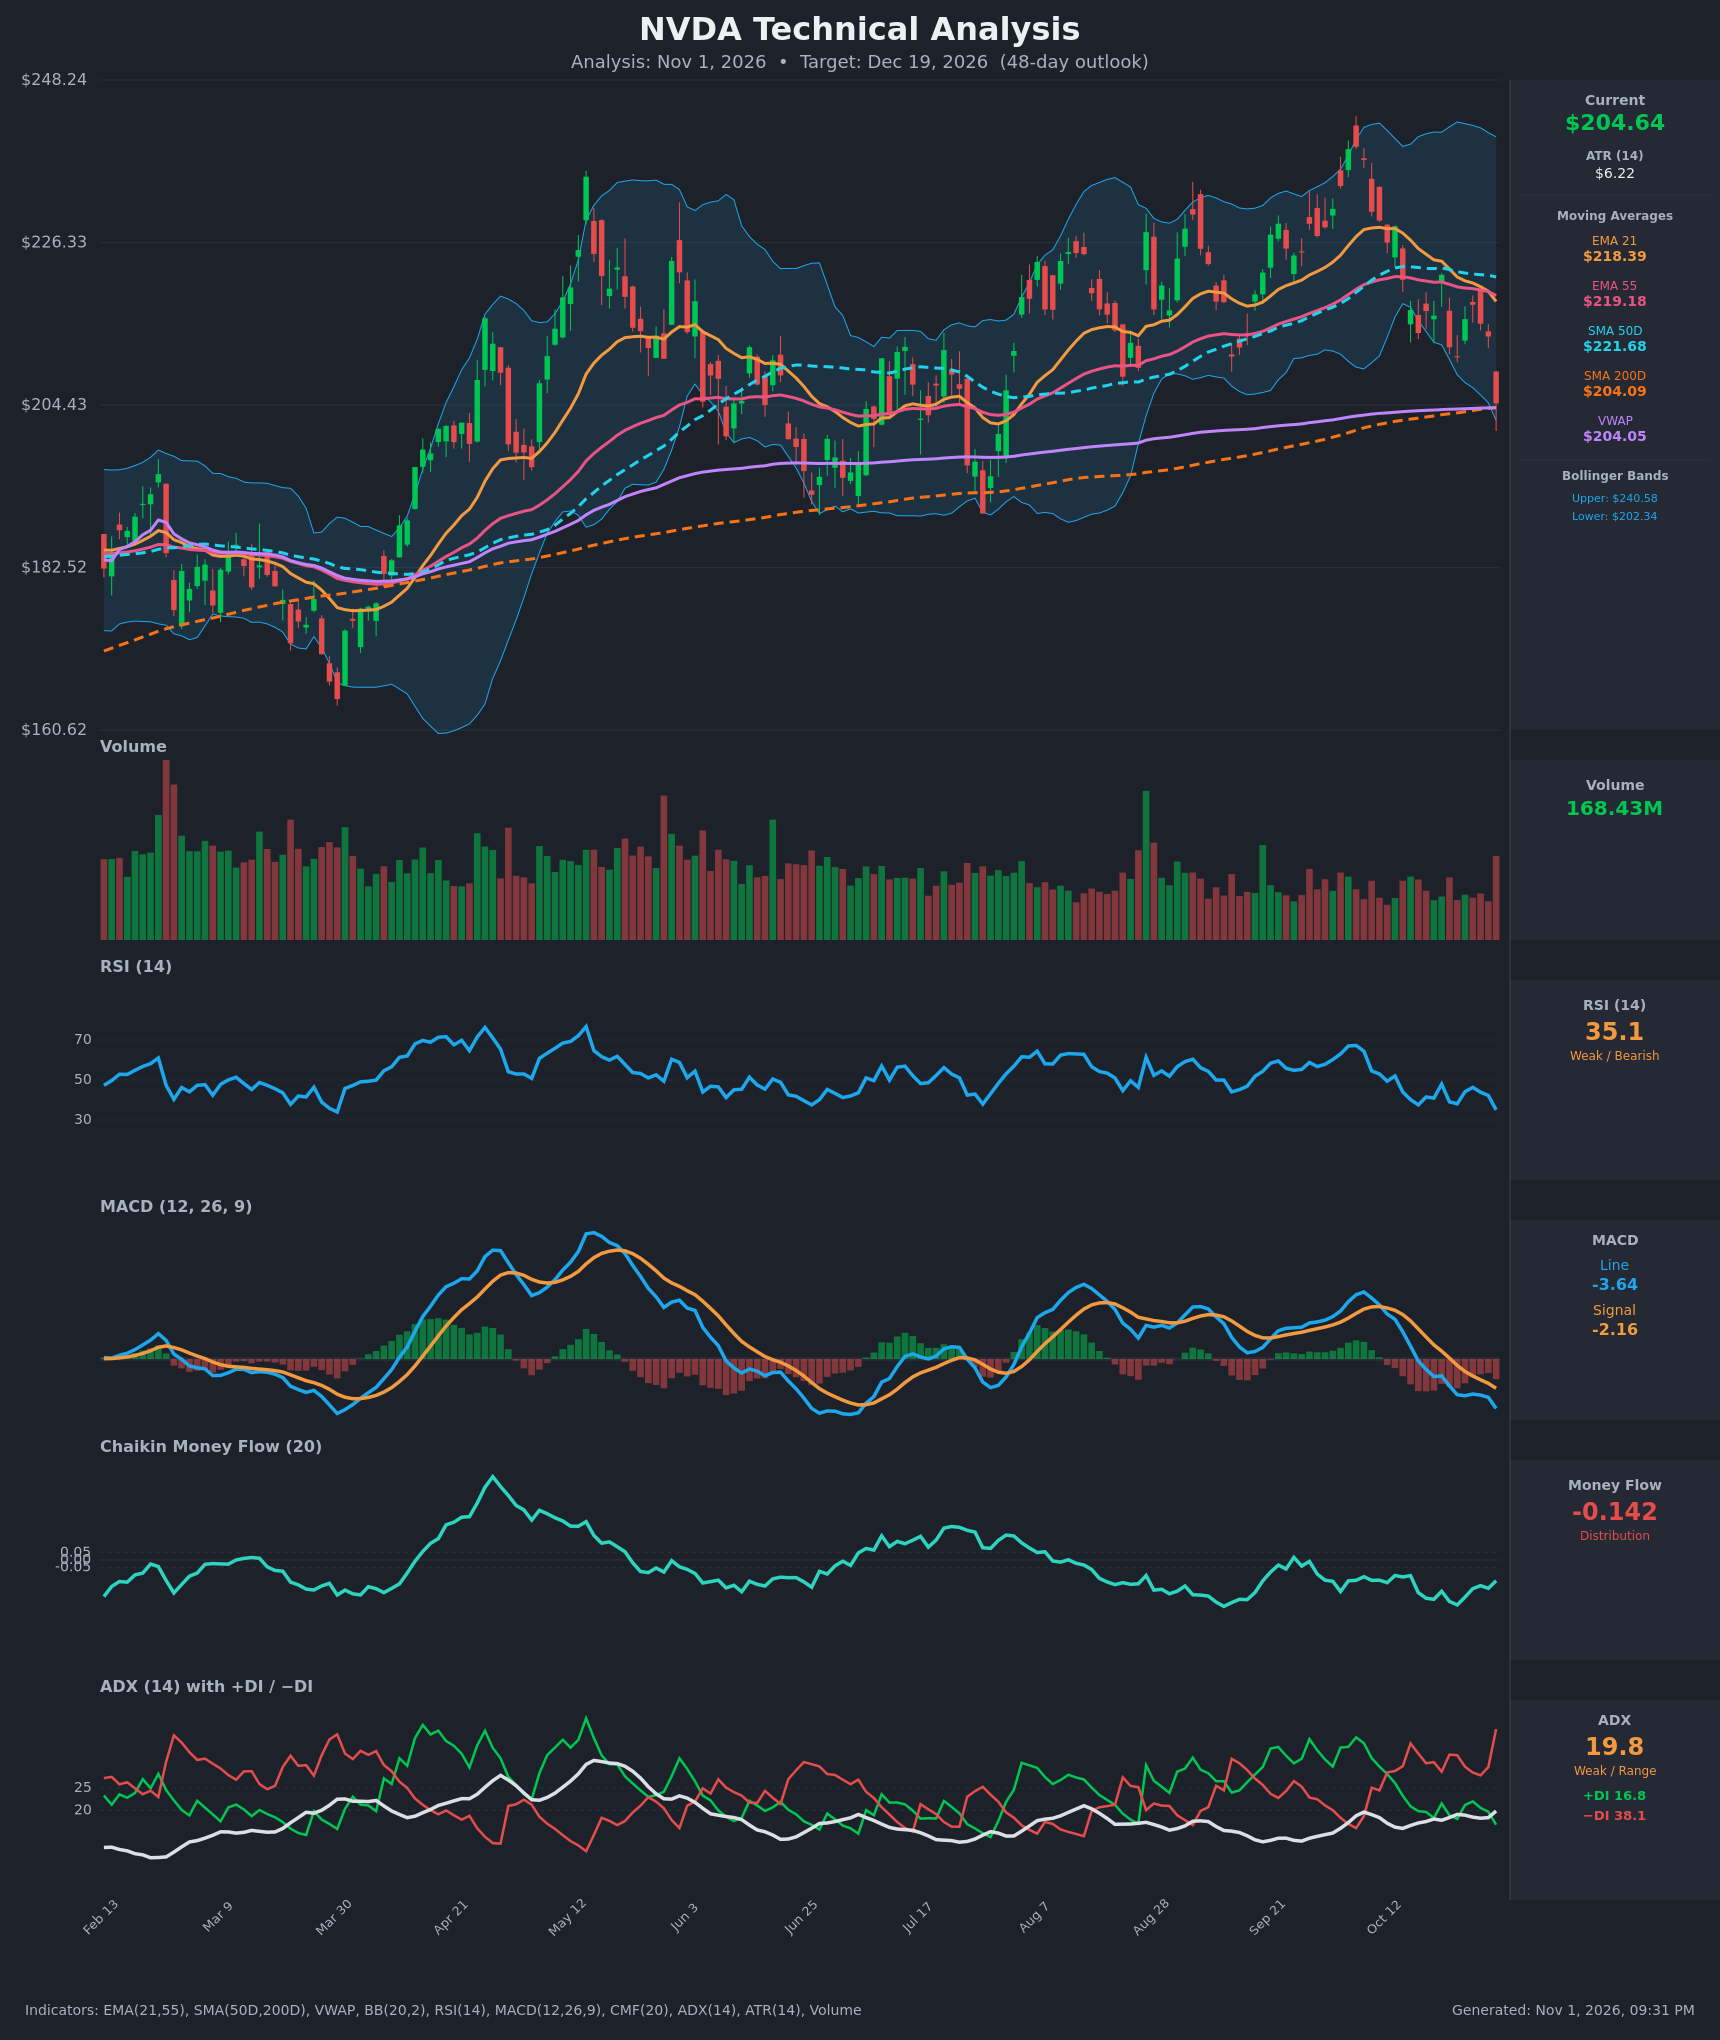
Analysis
TECHNICAL INDICATORS
- RSI (14): 35.07, down from ~47 on Oct 21 and approaching the 30 oversold line. Momentum is clearly falling, but it is not yet oversold. [Bearish]
- 20 EMA (EMA 21): $218.39, with price at $204.64 about 6.3% below it. The EMA21 has crossed under the EMA55 ($219.18) and is sloping down, so it acts as overhead resistance. [Bearish]
- MACD: Line -3.64 is below signal -2.16, and the bearish crossover happened around Oct 23. The histogram is negative and widening, with both lines falling. [Bearish]
- Bollinger Bands (20): Bands run $202.34 to $240.58. Price at $204.64 sits at the lower band after a sharp -4.2% drop on Oct 30. A band-walk is possible, though a snap-back toward the mid-band (~$221) is also possible. [Bearish]
- CMF (20): -0.142, below the -0.05 threshold and negative for the entire 15-bar window, which points to persistent distribution. [Distribution]
- ADX (14): 19.8 with -DI 38.1 versus +DI 16.8. The trend is not yet strong, but ADX is rising and the DI spread is wide, so bears are clearly in control. [Weak but strengthening trend – Bearish]
- Volume: 168.43M on the latest bar, a high-volume red candle and the heaviest in recent weeks. This is a volume-confirmed breakdown. [Bearish]
Moving average and VWAP context:
- SMA50D is $221.68 and SMA200D is $204.09.
- Price is at SMA200D and VWAP ($204.05), a confluence support zone.
- A death cross has not occurred, since the SMA50 is still well above the SMA200.
- The 200D is the last major long-term support.
DIVERGENCES & TRENDS
- There is no bullish RSI divergence yet. RSI is making lower lows alongside price.
- The MACD peak near late Sep/early Oct was lower than the May peak, a bearish momentum fade over the larger trend.
- The EMA21 crossed below the EMA55 and price lost all short-term MAs, including the SMA50, with a sequence of lower highs since the ~$240 high.
- The -DI spike to 38 on a rising ADX suggests a trend developing to the downside.
- Price is testing the SMA200D, VWAP and lower Bollinger Band all at once. This is a key decision point where a break would accelerate selling.
- RSI 35 and the lower band suggest short-term oversold conditions, so bounces are likely even within a downtrend.
CHART PATTERNS
- The pattern most consistent with the chart is a Bearish Rising Wedge / Double Top reversal. The ~$240 peak was followed by a series of lower highs and a breakdown below the $210-212 support area.
- Price formed lower highs at ~$228, ~$222 and ~$218 while lows near $210-212 were broken. This resembles a bearish pennant/flag continuation on a downward leg.
- A measured move from the ~$240 top to the $210 breakdown suggests about $30 of downside. Applied from the $210 breakdown, that gives a target near $180-185, which aligns with the prior consolidation low and the March-April base.
- The SMA200D (~$204) is the key line. A decisive close below it would validate the breakdown.
POTENTIAL SCENARIOS
- Scenario 1: Bearish Breakdown Below the 200-Day — Price loses the SMA200D/VWAP/lower-band confluence, with -DI dominance, negative CMF and a bearish MACD all supporting continuation. Trigger: daily close below ~$202 on elevated volume. Target: $188-$192, extended to ~$182. Invalidation: close back above $219 (EMA55/EMA21 cluster). (50% probability)
- Scenario 2: Neutral/Choppy Base Around the 200-Day — The SMA200D and lower band hold, and price oscillates between $198 and $218 as oversold conditions are worked off. Trigger: holds above $200 with RSI stabilizing at 30-40. Target: $205-$215. Invalidation: close below $198 or above $222. (22% probability)
- Scenario 3: Bullish Oversold Rebound — Oversold bounce from the 200D, recovering to the mid-band. Trigger: reclaim of $212 with a positive CMF turn and MACD histogram contraction. Target: $218-$222 (EMA21/EMA55/SMA50 cluster). Invalidation: close below $200. (28% probability)
PRICE TARGETS
Timeframe: 48 days (range width guideline ~12-18% to 18-30%; using ~20% given the 48-day horizon and ATR of $6.22).
- Target Price: $196.50 (the 200D breaks and price drifts lower, partially offset by oversold bounces)
- Expected Range: $179.00 to $219.00 (width $40 = ~19.5% of current price)
- Key Levels: Support at $202.30 (lower Bollinger Band / SMA200D zone), Resistance at $218.40 (EMA21, with EMA55 and SMA50D just above)
OVERALL BIAS
OVERALL BIAS: BEARISH - Price has lost the EMA21, EMA55 and SMA50D, MACD has crossed bearish, CMF shows persistent distribution, and -DI (38.1) dominates +DI (16.8). The latest heavy-volume breakdown is testing the SMA200D, and a failure there targets the high-$180s to low-$190s, with oversold bounces likely along the way.
This is educational analysis and not financial advice.