NOK 48-day bearish forecast — Nov 1, 2026
- Bias: Bearish
- Timeframe: 48 days (made Nov 1, 2026, target date Dec 18, 2026)
- Price at analysis: $8.56
- Price target: $8.05
- Expected range: $6.85 – $9.15
- Result: Pending — graded after the close on Dec 18, 2026
Get a free AI analysis of NOK today
Analysis
TECHNICAL INDICATORS
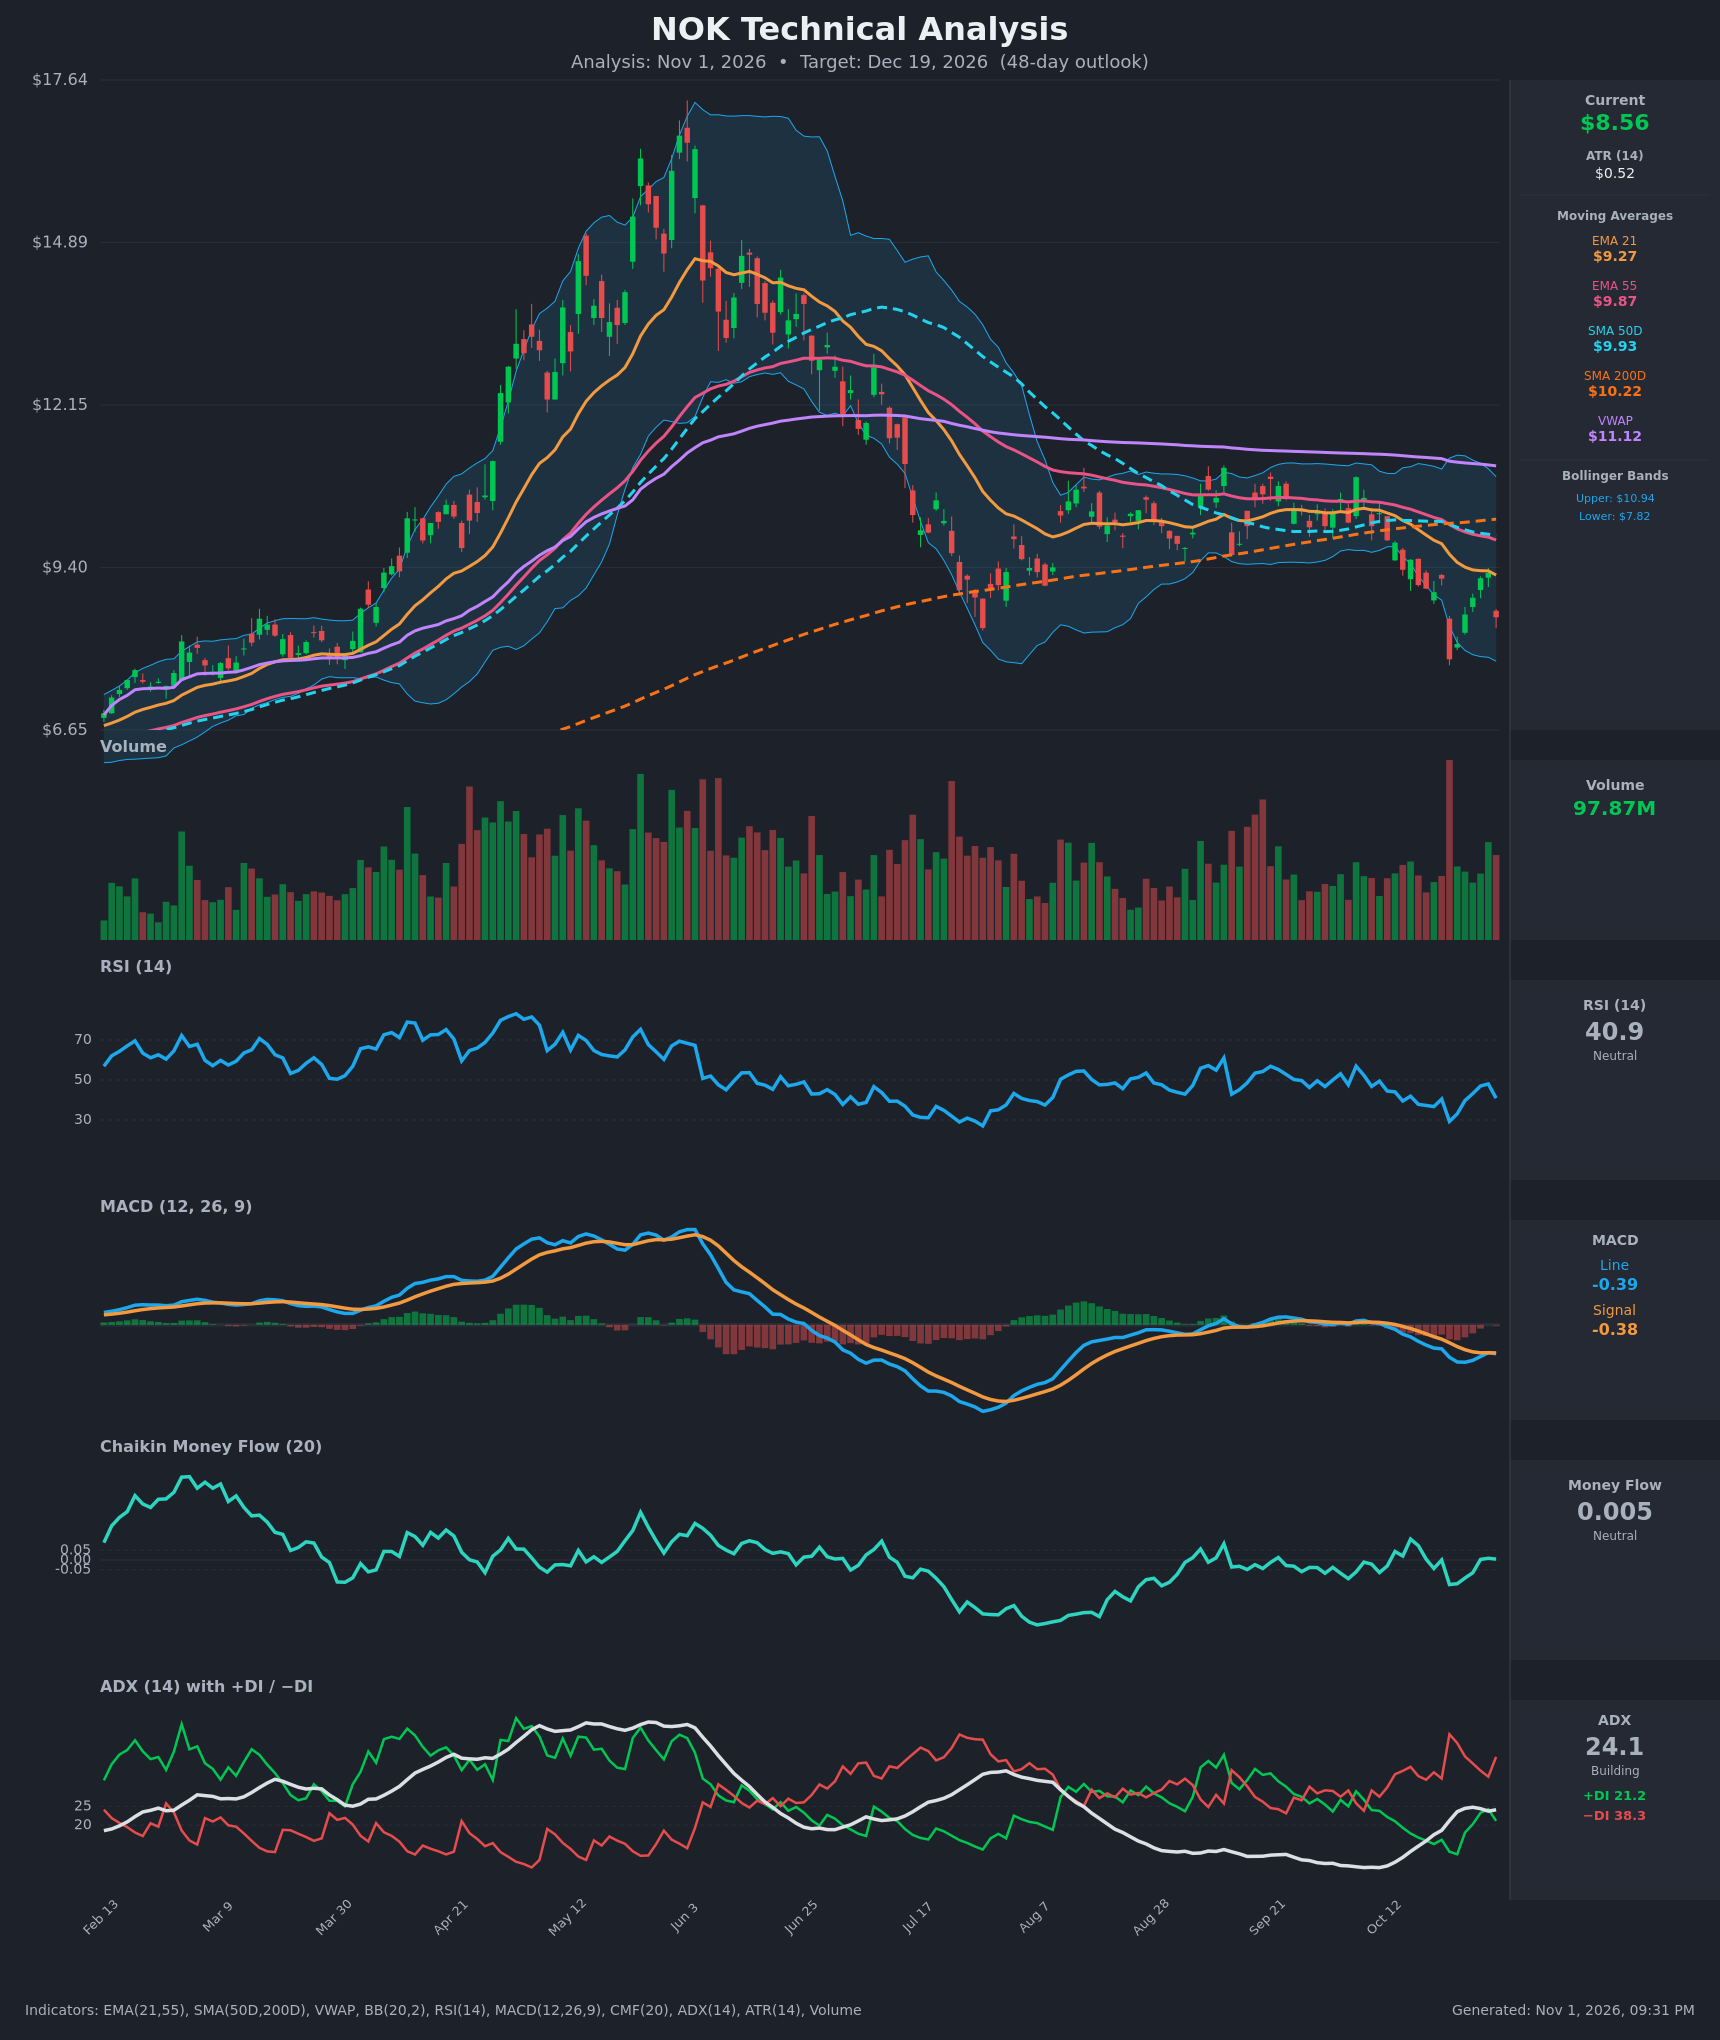
- RSI (14): 40.93, down from 48.0 on Oct 29 after a sharp -8% reversal day on Oct 30. It is below 50 but above the oversold zone (the Oct 22 low was 29.3). The trend of lower RSI highs since the June peak is intact. [Bearish]
- 20 EMA (EMA 21 = $9.27): Price at $8.56 is about 7.7% below the EMA 21, which is also below the EMA 55 ($9.87). The EMA 21 is sloping down and acting as resistance. [Bearish]
- MACD: Line -0.386 is below Signal -0.376, so the bullish cross on Oct 29 (-0.371 vs -0.373) was rejected. Both lines are negative and the histogram is slightly negative, showing fading but still bearish momentum. [Bearish]
- Bollinger Bands (20): Upper $10.94, lower $7.82, mid-band around $9.38. Price sits in the lower third, about 0.74 of the band-width distance below the mid-band. The lower band at $7.82 matches the Oct 22 flush low ($7.85). The bands are wide after the volatility spike. [Bearish]
- CMF (20): 0.005, between -0.05 and +0.05, so neutral. It has recovered from -0.126 on Oct 22, which shows the selling pressure has eased, but there is no real accumulation yet. [Neutral]
- ADX (14): 24.1 and rising from 9.1 on Oct 12, close to the 25 threshold, so a trend is building. −DI at 38.3 is well above +DI at 21.2, with bears in control and the spread widening again after the bounce. [Strong Trend – Bearish]
- Volume: 97.87M, above the recent average. The Oct 22 capitulation bar was the largest on the chart. The latest red candle came on elevated volume, which confirms the rejection from the EMA 21. [Bearish]
DIVERGENCES & TRENDS
- Price made a lower low on Oct 22 ($7.85) while RSI hit 29.3, and the bounce was sharp. The Oct 30 close at $8.56 is a higher low than $7.85, so the structure is not yet broken, but the rally failed at the EMA 21 ($9.3).
- There is a mild bullish divergence in CMF, which recovered to neutral while price made a lower low. The effect is limited because price has since rolled over.
- The moving averages are stacked bearishly: price < EMA 21 < EMA 55 < SMA 50D ($9.93) < SMA 200D ($10.22) < VWAP ($11.12). The SMA 50D has crossed below the EMA 55 and is converging with the SMA 200D, so a death cross is imminent or just forming (the gap is about $0.29).
- The MACD bullish cross failed, and the MACD line has turned back down below the signal. The ADX is rising with −DI dominant.
- Price lost the SMA 200D, which had been support for the August–October range (~$9.0–$10.5).
CHART PATTERNS
- The chart shows a broad rounded top / distribution (the May–June peak near $17) followed by a long decline. It then formed a range at $9–$10.5 from August to October, which functions like a Descending Triangle / Bearish Rectangle. The Oct 22 break below the range is a bearish continuation signal.
- The flush to $7.85 followed by a bounce to $9.31 that failed at the EMA 21 resembles a bearish pennant / dead-cat bounce. The measured move from the breakdown points to about $7.60–$8.00 on a retest.
- The range top at $9.3–$10.0 should be stiff resistance. A reclaim above $9.9 would negate the bearish pattern.
POTENTIAL SCENARIOS
- Scenario 1: Bearish Retest of Lows — The failed bounce at the EMA 21 and the −DI dominance lead to a retest of the Oct 22 low and the lower Bollinger Band, with possible undercut. Trigger: close below $8.20 and a MACD histogram expansion. Target: $7.60–$7.85 (retest of the low), with an extension to ~$7.30. Invalidation: daily close above $9.35 (EMA 21). (50% probability)
- Scenario 2: Neutral/Choppy Base — Price holds above the $7.85 low and consolidates in the $7.9–$9.2 range as ADX stalls near 25 and CMF stays flat. Trigger: RSI holds 35–50 and volume dries up. Target: $8.2–$8.9. Invalidation: close outside $7.80–$9.30. (28% probability)
- Scenario 3: Bullish Reclaim — A second bounce clears the EMA 21 and EMA 55, squeezes shorts and rises toward the SMA 50D/200D cluster. Trigger: close above $9.35 on volume with +DI crossing above −DI. Target: $9.90–$10.20. Invalidation: close back below $8.50. (22% probability)
PRICE TARGETS
- Target Price: $8.05 (48 days, Dec 19, 2026)
- Expected Range: $6.85 to $9.15 (width $2.30, about 26.9% of the current price, in line with the ~12-18% guide scaled up for the high volatility: ATR is 6.1% of price and the 48-day window is at the long end of the 30–60 day band, so I used a wider range to reflect the Oct 22 gap)
- Key Levels: Support at $7.85, Resistance at $9.27
OVERALL BIAS
OVERALL BIAS: BEARISH - Price is below every moving average with −DI (38.3) far above +DI (21.2), a rejected MACD cross, and a likely death cross forming. The bounce stalled at the EMA 21, so a retest of the $7.85 low is the most probable path.
This is educational analysis and not financial advice.