ORCL 48-day bearish forecast — Nov 1, 2026
- Bias: Bearish
- Timeframe: 48 days (made Nov 1, 2026, target date Dec 18, 2026)
- Price at analysis: $130.67
- Price target: $126.50
- Expected range: $109.50 – $141.50
- Result: Pending — graded after the close on Dec 18, 2026
Get a free AI analysis of ORCL today
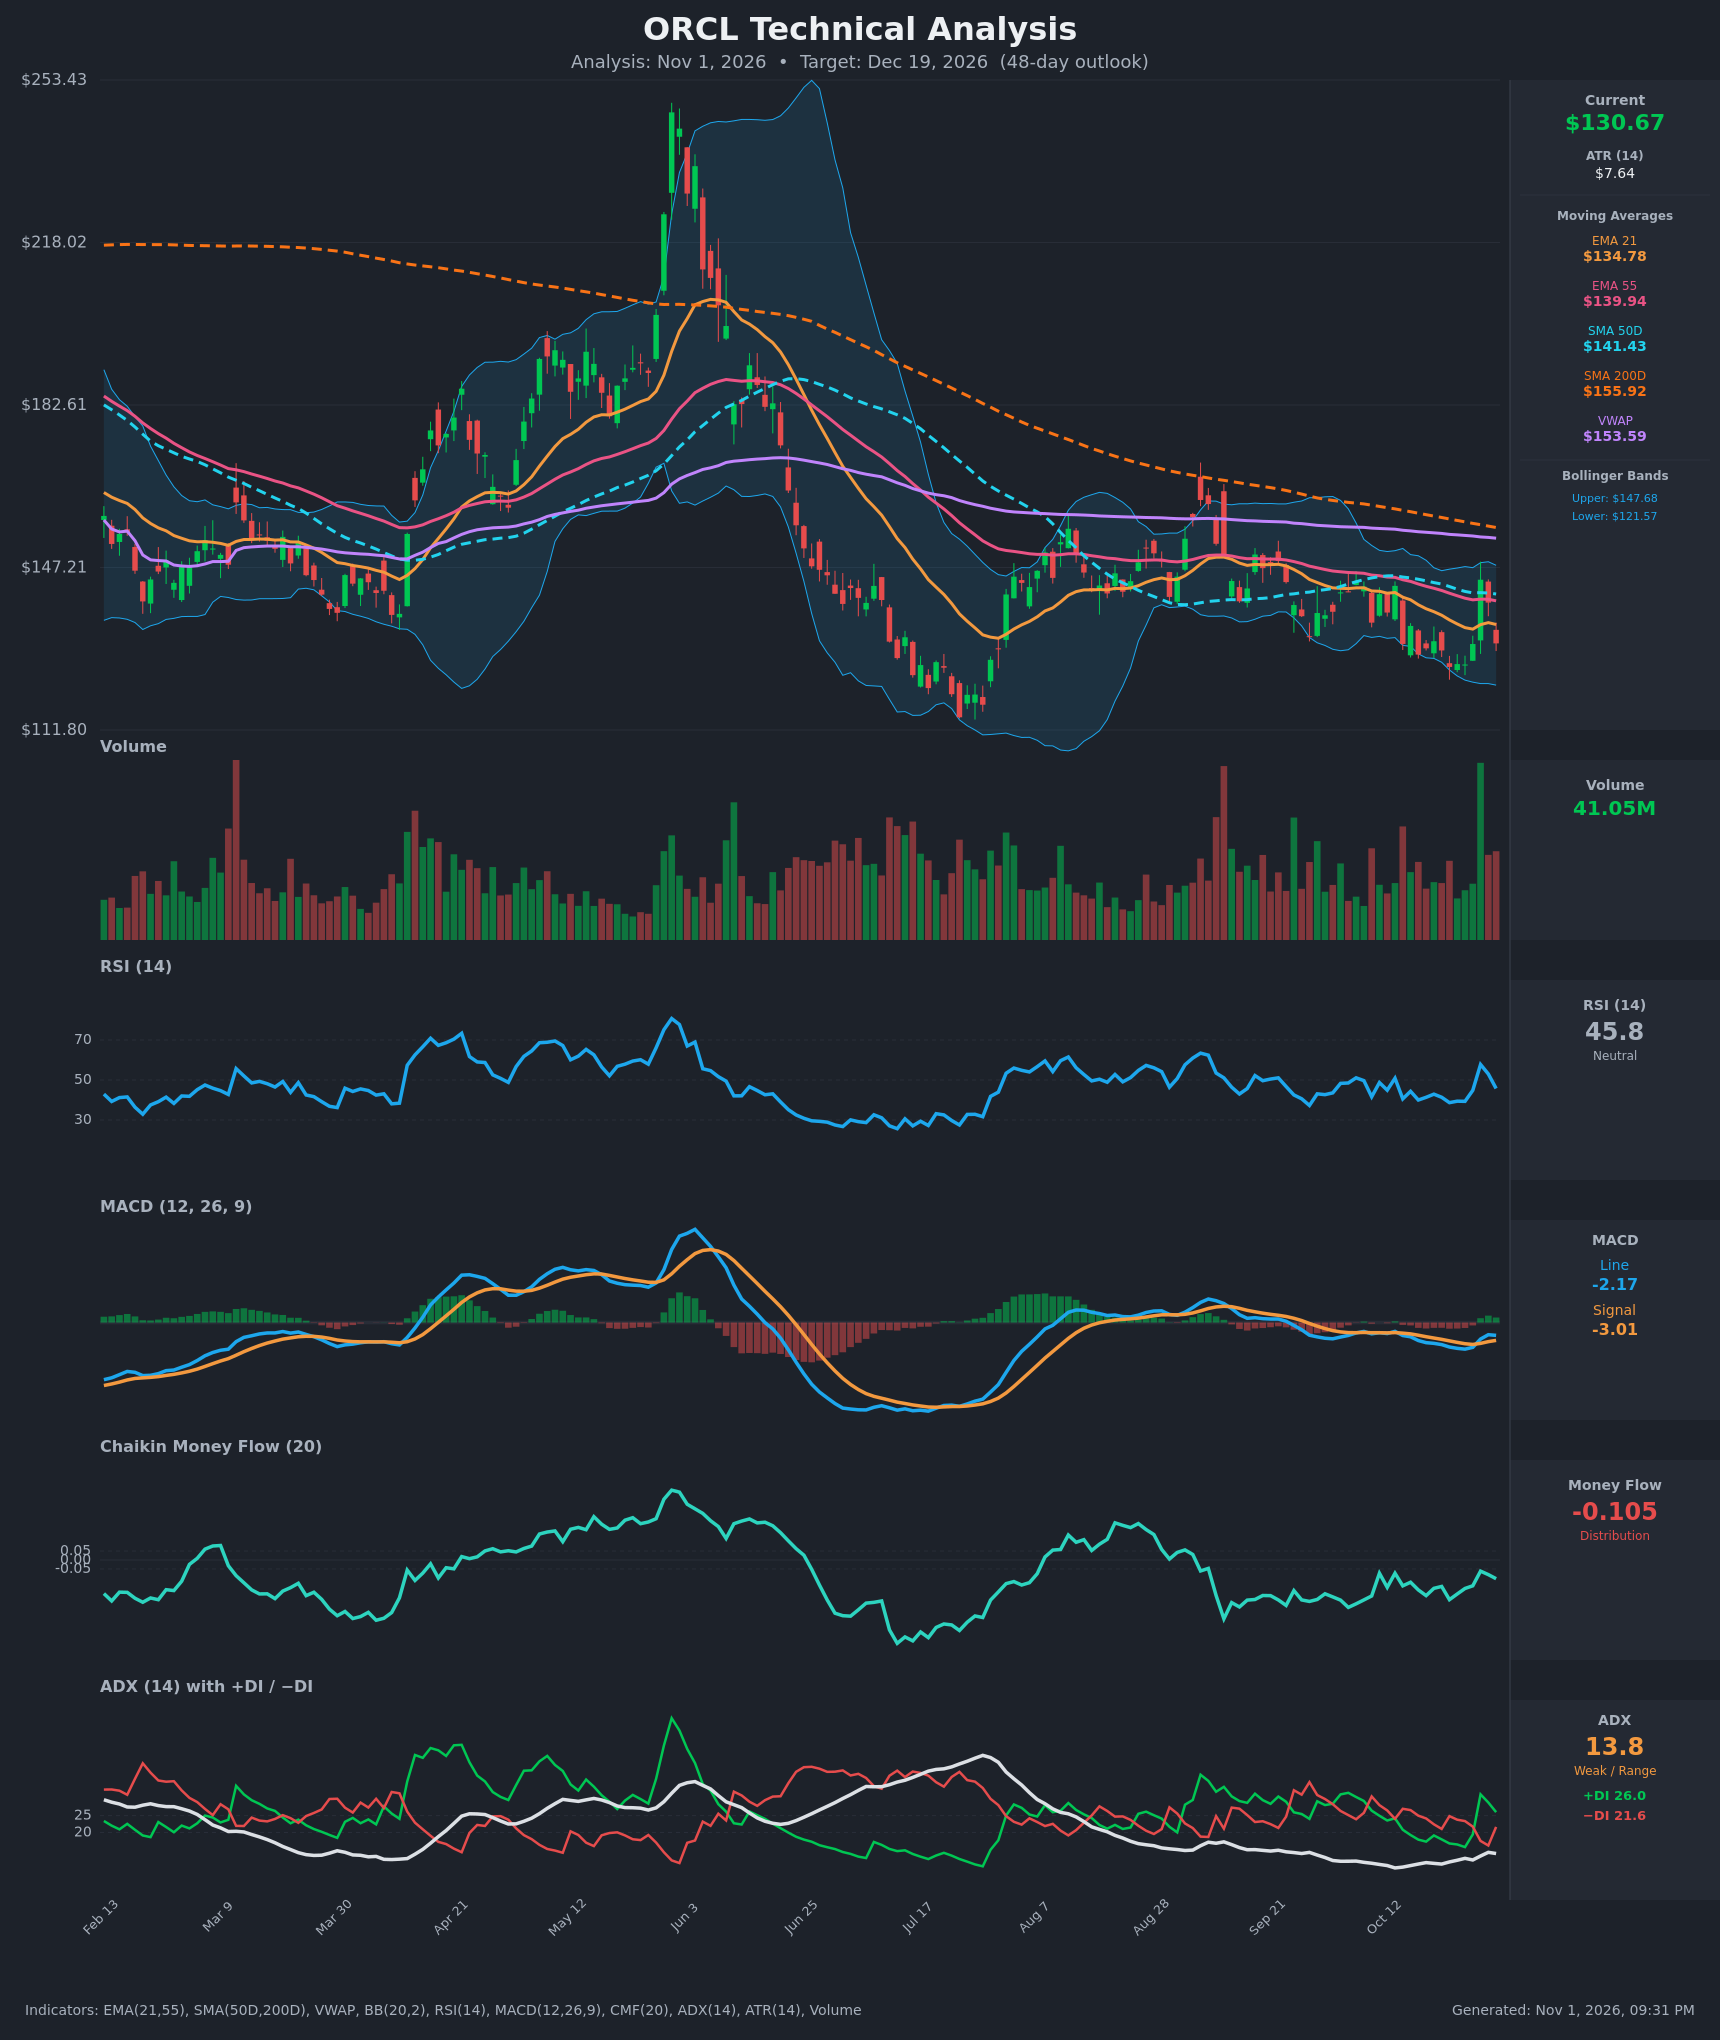
Analysis
TECHNICAL INDICATORS
- RSI (14): 45.76, below the 50 midline and falling from 57.8 on Oct 28. It shows no oversold or overbought extreme, and the recent spike faded quickly. [Bearish]
- 20 EMA (EMA 21): $134.78, with price at $130.67 below it. EMA21 is also below EMA55 ($139.94), a bearish stack that is acting as overhead resistance. [Bearish]
- MACD: Line -2.17 is above the signal at -3.01, so the histogram is slightly positive. This is a minor bullish crossover, but both lines sit well below zero, so it is only a bounce in a downtrend. [Neutral]
- Bollinger Bands (20): Upper $147.68, lower $121.57, midline about $134.63. Price is below the midline in the lower half of the bands. The Oct 28 spike to $144.54 was rejected quickly, and the bands are fairly narrow. [Bearish]
- CMF (20): -0.105, below -0.05 and negative for the whole recent window. This shows persistent distribution, and rallies are being sold. [Distribution]
- ADX (14): 13.8, a weak trend and range-bound. +DI (26.0) is above -DI (21.6), but only after the Oct 28 spike, and that bullish edge is fading. Neither side shows trend conviction. [Weak Trend, slight bullish DI]
- Volume: 41.05M, with a big-volume spike on Oct 28 (the green up-day) that was then sold into. Distribution on red days is heavy relative to the base. [Mixed / Bearish tilt]
Longer-term structure is bearish. Price is below SMA50D ($141.43) and far below SMA200D ($155.92). SMA50D is below SMA200D (a death cross is in place), and price is below VWAP ($153.59).
DIVERGENCES & TRENDS
- Price made lower lows on Oct 22–26 (about $125.5), while RSI held in the high 30s. This is no strong divergence, but there is mild momentum stabilization.
- MACD has crossed up over its signal while still deeply negative. This is a weak relief signal rather than a trend change.
- All major moving averages (EMA21, EMA55, SMA50D, SMA200D) are falling, and price keeps failing at EMA21. The Oct 28 spike peaked at $144.54 and fully reversed to $130.67 within two sessions.
- CMF has stayed negative, so there is no accumulation to support a sustained rally.
- ADX is near its low of the year (13.8), which signals compression. Direction will probably come from a break of the $125–$126 or $145 area.
CHART PATTERNS
- The price has been grinding sideways to lower for about 2 months, with lower highs near $144–$149 and support around $125–$126. This resembles a Bearish Descending Triangle / Bearish Flag continuation after the large drop from the $250 peak. A break below $125 would project a measured move toward $115–$118.
- The $125.5–$126 area has been tested multiple times (Oct 22, 23, 26), forming a tentative flat base. This could also be read as a Double/Triple bottom attempt, but it lacks volume and CMF confirmation.
- The spike candle on Oct 28 that failed at the Bollinger upper area and EMA/SMA cluster looks like a bull trap.
POTENTIAL SCENARIOS
- Scenario 1: Bearish Breakdown Continuation — Price fails at EMA21 and the $134–$135 area, loses the $125–$126 support, and heads toward the prior July lows. Trigger: daily close below $125.50 on above-average volume. Target: $116–$119. Invalidation: daily close above $141.50 (SMA50D). (45% probability)
- Scenario 2: Neutral Range Chop — Weak ADX keeps price between $122 and $142, with repeated rejections at EMA21/EMA55 and buyers defending $125. Trigger: no decisive close outside $125–$142. Target: $126–$136. Invalidation: close below $122 or above $144.50. (30% probability)
- Scenario 3: Bullish Relief Rally — MACD bullish crossover and oversold bounce reclaim the EMAs and push to the SMA cluster. Trigger: close above $141.50 on rising volume with CMF turning positive. Target: $147–$150. Invalidation: close back below $130. (25% probability)
PRICE TARGETS
- Target Price: $126.50 (48 days)
- Expected Range: $109.50 to $141.50 (width $32.00, about 24.5% of current price, appropriate for a 48-day horizon using an ATR of $7.64)
- Key Levels: Support at $125.50, Resistance at $134.78
OVERALL BIAS
OVERALL BIAS: BEARISH - Price is below all key moving averages with a death cross in place, CMF shows persistent distribution, and the Oct 28 rally failed at resistance. The MACD crossover is shallow and ADX is weak, so conviction is moderate, but the evidence favors a drift lower toward and possibly below the $125 support.
This is educational analysis and not financial advice.