NBIS 48-day bearish forecast — Nov 1, 2026
- Bias: Bearish
- Timeframe: 48 days (made Nov 1, 2026, target date Dec 18, 2026)
- Price at analysis: $154.14
- Price target: $143.00
- Expected range: $128.00 – $156.00
- Result: Pending — graded after the close on Dec 18, 2026
Get a free AI analysis of NBIS today
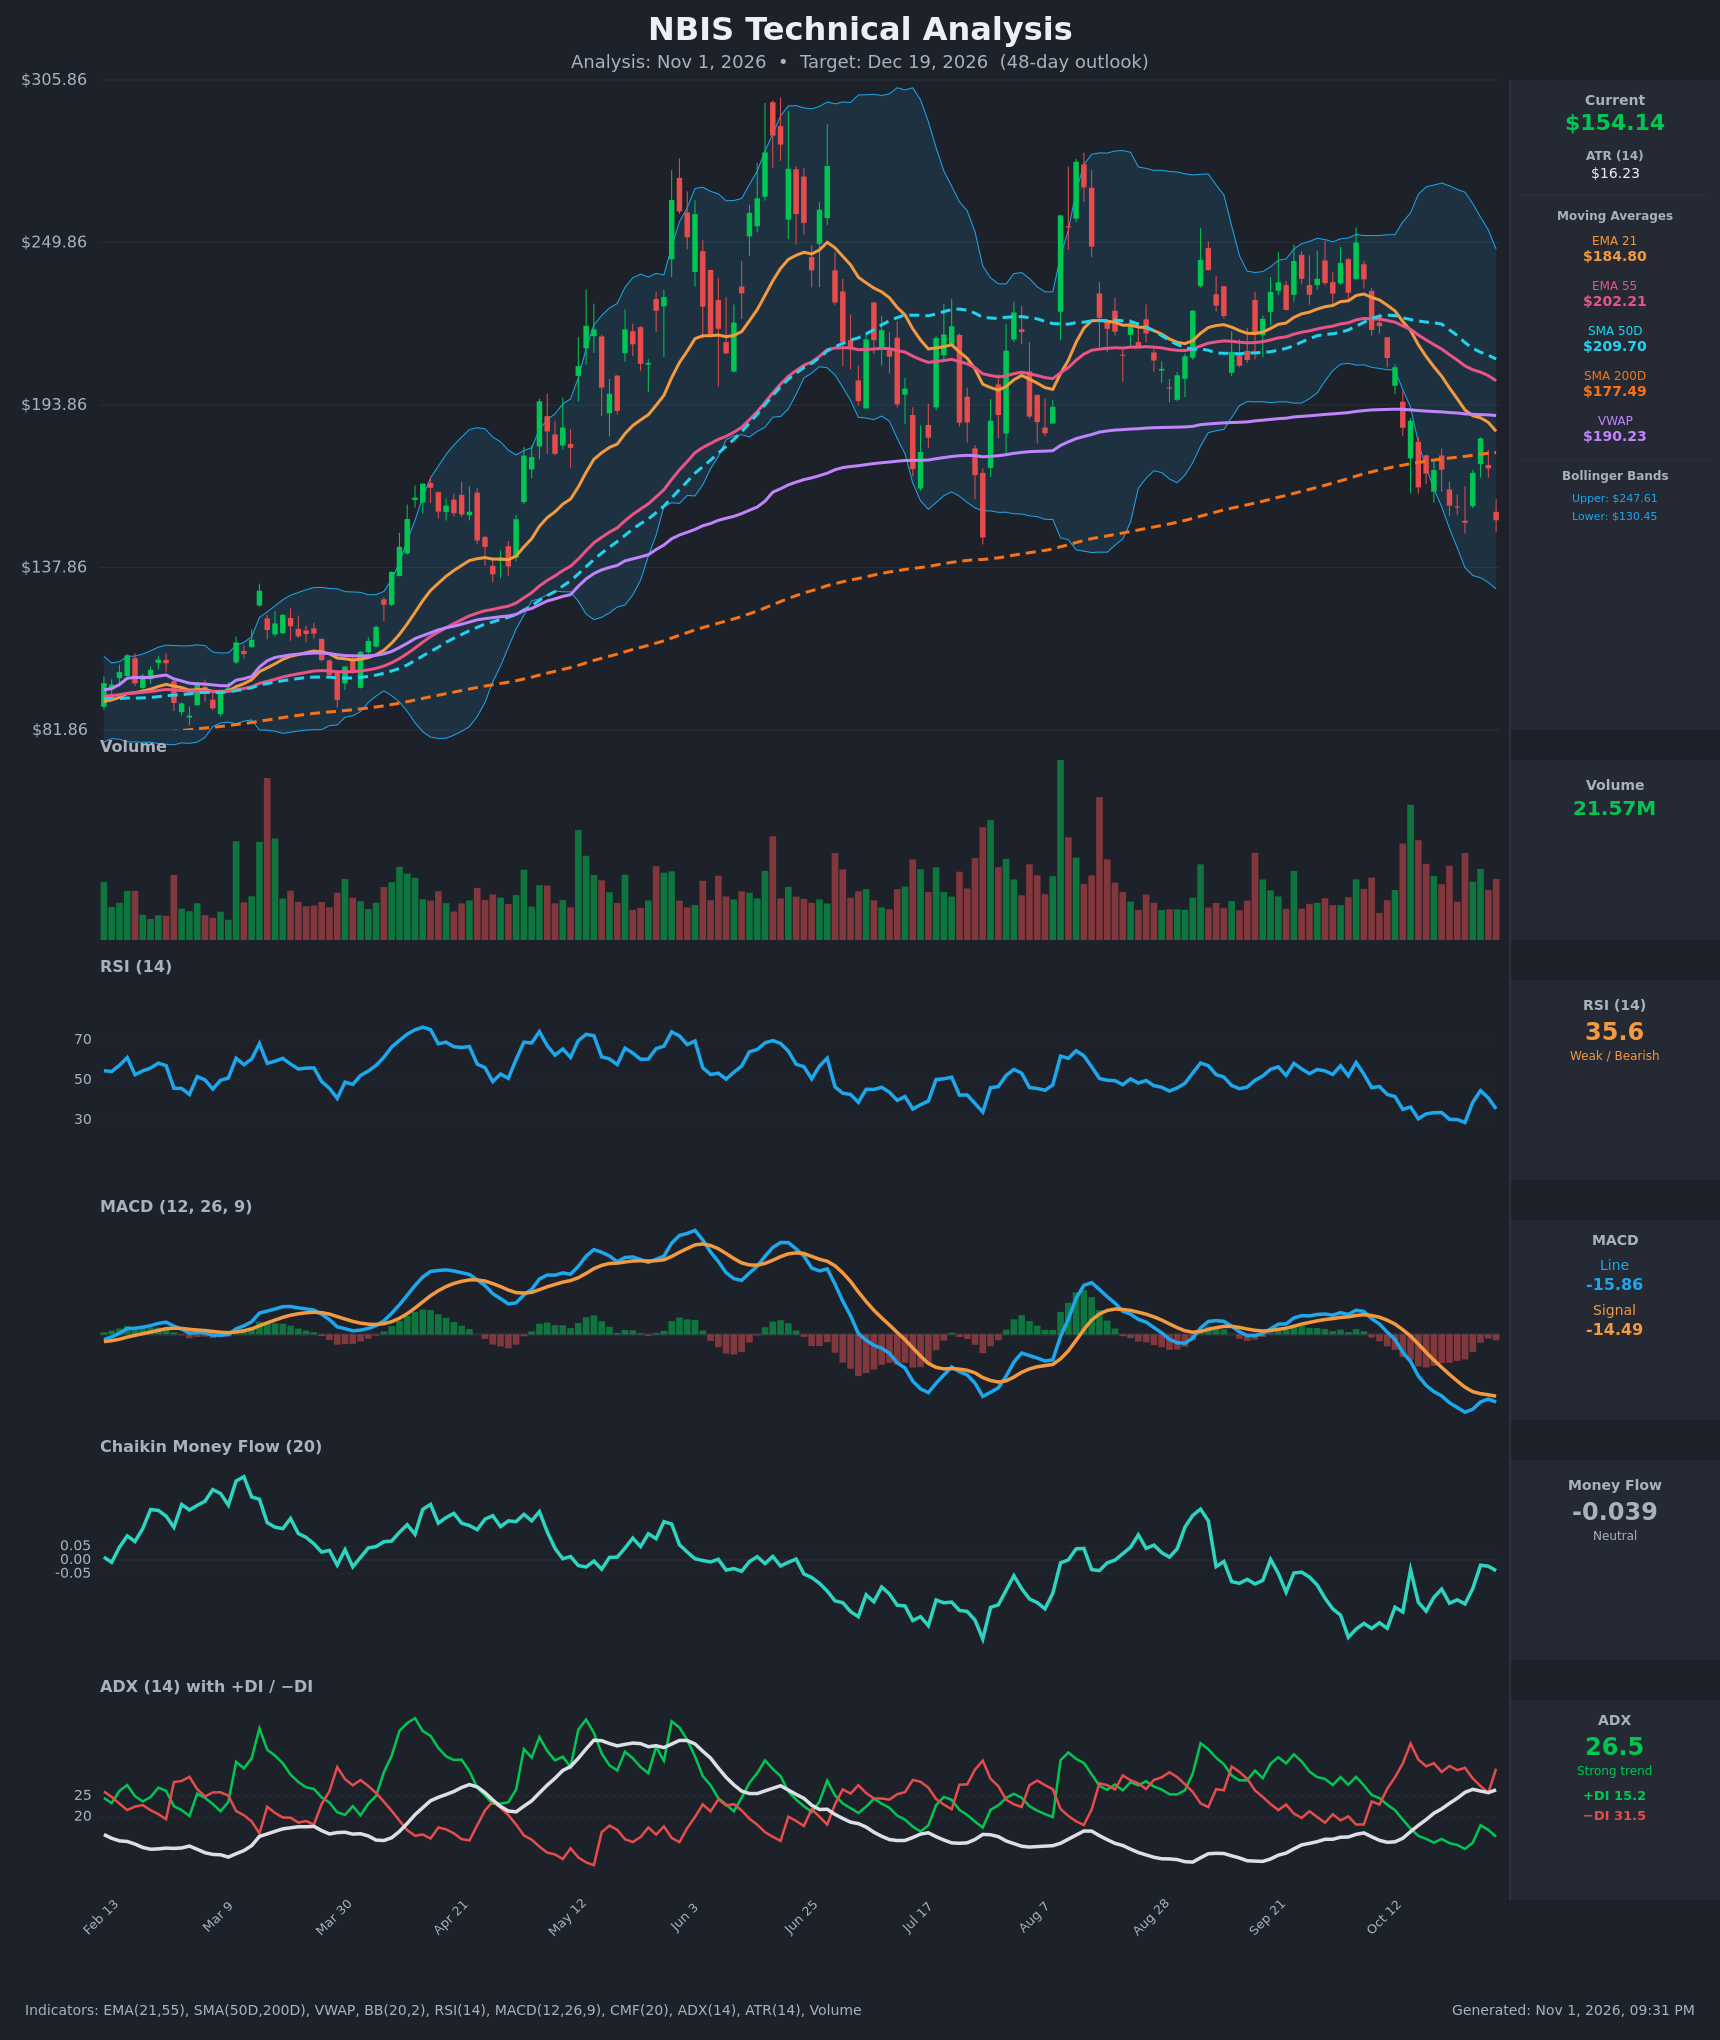
Analysis
TECHNICAL INDICATORS
- RSI (14): 35.58, down from 44.7 on Oct 28 after a bounce from 28.8 on Oct 26. It is weak but not yet oversold. The failed rebound under 50 suggests sellers are still in control. [Bearish]
- 20 EMA (EMA 21 = $184.80): Price at $154.14 is about 16.6% below it, and the EMA is sloping down steeply. EMA21 is also below EMA55 ($202.21), a bearish cross that occurred around Oct 15. The EMA21 is overhead resistance. [Bearish]
- MACD: Line -15.86 is below Signal -14.49, with a negative, widening histogram. The bearish crossover happened Oct 15. The brief narrowing on Oct 28-29 has reversed, and both lines are deeply below zero. [Bearish]
- Bollinger Bands (20): Upper $247.61, lower $130.45, midline about $189. Price sits in the lower third of the band, about $23.70 above the lower band. The bands are wide, so volatility is elevated. This is a downtrend "walk" toward the lower band rather than an oversold extreme. [Bearish]
- CMF (20): -0.039, inside the neutral zone (±0.05) but negative on nearly every bar for 15 sessions. Selling pressure is mild, not heavy, and there is no accumulation. [Neutral]
- ADX (14): 26.5, rising from 13.9, so a trend has emerged. −DI (31.5) is well above +DI (15.2), meaning bears dominate. [Strong Trend – Bearish]
- Volume: 21.57M is moderate. The sell-off bars on Oct 14 and Oct 16 and the broader decline carried heavy volume. The Oct 27-28 bounce was not followed by buying volume, and today's drop to $154 came on average-to-above-average volume. [Bearish – distribution on declines]
DIVERGENCES & TRENDS
- No bullish RSI divergence yet. Price on Oct 30 ($154.14) is almost level with the Oct 26 low ($153.27), while RSI is higher (35.6 vs 28.8). This is a mild positive divergence that would matter only if price holds $153. MACD is making lower lows, so it does not confirm.
- Moving averages: Price has broken below the SMA200D ($177.49), which is a major long-term trend breach. SMA50D ($209.70) is above SMA200D, so there is no death cross yet. SMA50D is falling and SMA200D is rising, so a death cross is possible in the coming weeks. EMA21 below EMA55 is already confirmed.
- VWAP: Price is well below VWAP ($190.23), confirming sellers are in control.
- Trend: The EMA stack is bearish and ADX is rising with −DI dominant. The rebound to $182 on Oct 28 stalled below EMA21, and the lower high is a bearish sign.
CHART PATTERNS
- Bearish Double Top (macro): Peaks at about $270 (Aug) and about $250 (Oct) with a neckline near $150-153 (July low and Oct 26 low). A close below that neckline would confirm the pattern. The measured move is large, but $130 (lower Bollinger Band) and about $137 (prior consolidation) are the realistic first targets.
- Bullish Double Bottom (competing, minor): The Oct 26 low ($153.27) and the Oct 30 close ($154.14) form a potential double bottom, with a neckline around $182. This is only valid on a close above about $182, which is also the EMA21 area, and that is unlikely near term.
- Bearish Flag-like bounce: The Oct 26-28 rebound to $182 followed by the drop back is consistent with a bearish continuation. A break of $153 would target about $130-137.
POTENTIAL SCENARIOS
- Scenario 1: Bearish Neckline Breakdown — Price fails to hold the $153 support, which is the double-bottom low and double-top neckline. Selling continues under bearish MACD and −DI dominance, with the SMA200D now acting as resistance. Trigger: daily close below $150-153 on rising volume. Target: $137, then $130 (lower Bollinger Band), with the 48-day target near $143. Invalidation: daily close back above $177.49 (SMA200D). (50% probability)
- Scenario 2: Bullish Double-Bottom Relief Rally — The $153 level holds, RSI divergence plays out, and price rebounds toward the SMA200D and EMA21 zone. Trigger: close above $172 with improving CMF (>+0.05). Target: $177-185, with a possible extension to $190 (VWAP). Invalidation: close below $150. (32% probability)
- Scenario 3: Neutral Range Consolidation — Price chops between $135 and $175 as volatility compresses after the sharp decline. Trigger: ADX rolls over below 25 and RSI stabilizes in the 35-45 area. Target: roughly $150-160. Invalidation: close beyond either $135 or $177. (18% probability)
PRICE TARGETS
- Target Price: $143.00 (48 days, Dec 19, 2026)
- Expected Range: $128.00 to $156.00 (width $28 = about 18.2% of current price, consistent with the 30-60 day guidance of 12-18%)
- Key Levels: Support at $153.27 (Oct 26 swing low; below it, $137 and $130.45), Resistance at $177.49 (SMA200D; above it, EMA21 at $184.80)
OVERALL BIAS
OVERALL BIAS: BEARISH - Price has broken below the SMA200D and every moving average, with MACD and the EMA21/EMA55 cross bearish and ADX (26.5) showing −DI dominance (31.5 vs 15.2). Only the retest of the $153 low offers a bullish counter, and a break of it opens a move toward $130-137.
This is educational analysis and not financial advice.